Introduction
The CRLI concept seeks to reduce the two most frequently used traditional performance indicators for total leakage to a single numerical figure – a laudable objective if it can be achieved. However the many problems caused by past generations in misusing %s of system input volume as a single performance indicator means that we should bear in mind the aphorism sometimes attributed to Einstein – everything should be as simple as possible but no simpler. Alan Wyatt, the originator of CRLI, has invited feedback on the use of CRLI as a leakage performance indicator, and his initiative has stimulated further debate on this topic.
The Unavoidable Annual Real Losses (UARL) equation developed by the 1st IWA Water Loss Task Force in 1995-99, incorporates length of mains, number of connections, length of private service connections (where applicable) and average system pressure, using Bursts and Background Estimates (BABE) concept with auditable assumptions for low leak frequencies, flow rates and durations for well-maintained systems in good condition.
The Infrastructure Leakage Index (ILI) is then the non-dimensional ratio of the Current Annual Real Losses divided by the UARL. Some potential users of UARL and ILI are put off by continuing to believe (or advising others) that it is simply too difficult to attempt to assess average operating pressure to calculate UARL and then ILI. Another aphorism: ‘Whether you think you can or you can’t, you’re right’(Henry Ford). UARL and ILI have been adopted and adapted by thousands of users around the world over the last 25 years to drive down leakage by systematically measuring and then reducing pressure. So is CRLI ‘now for something completely different’ (Monty Python) or does it have links to UARL and ILI?
These observations have been put together by Allan Lambert, the original developer of the UARL1999, and (with Kate Stanton-Davies) the more recent UARL with System Correction Factor customisation of UARL1999. It is hoped that they may be of interest to the deliberations of IWA Water Loss Specialist Group members, both at the San Sebastian Water Loss Conference in San Sebastian in April 2024, and current or potential users of CRLI. As Allan is now retired and unable to travel, the observations are posted on the free to all LEAKSSuite Library website; feedback is invited to Kate at San Sebastian or by using the form at Contact Leakssuite | LEAKSSuite Library and if any errors or misassumptions are identified they will then be corrected.
Allan Lambert, LEAKSSuite Library
Kate Stanton-Davies, Water Loss Research & Analysis Ltd
© 9th April 2024
Our Conclusions
Various conclusions of our research to date, based on content of a presentation by Alan Wyatt in November 2023 to the IWA Performance Indicators Group in Amsterdam, are:-
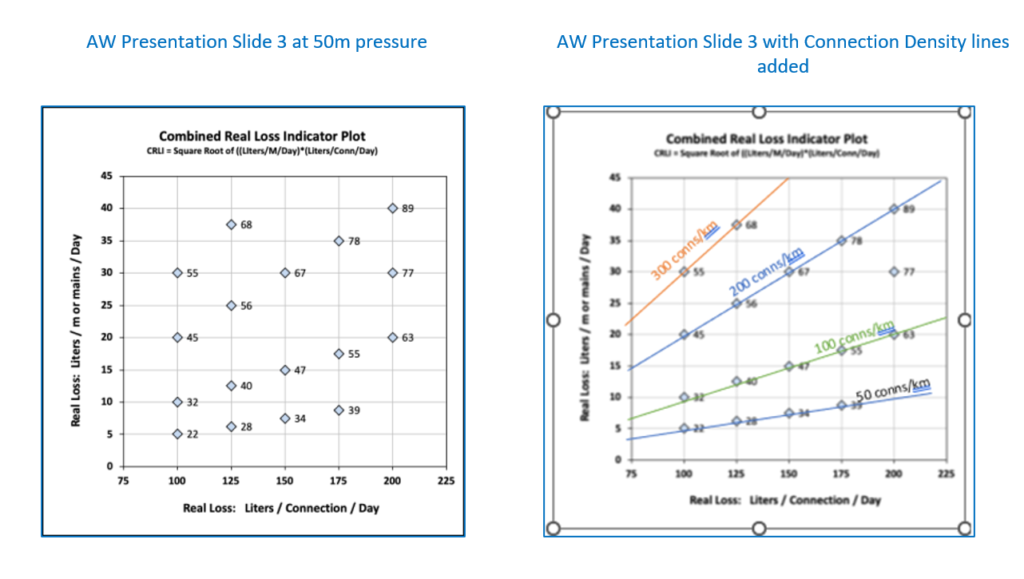
- CRLI is calculated as the square root of annual total leakage Lt (the sum of leakage on mains and leakage on services) expressed in litres/connection/day, multiplied by Lt expressed in litres/metre of mains per day. Because CRLI is a geometric (rather than arithmetic) mean of the two figures it cannot include leakage on private pipes after the property line.
- UARL equations which use connection density DC per km mains for litres/connection/day and m3/km mains/day, when calculated as CRLIs, exactly reproduce spot values for baseline CRLI values at 50 metres pressure below calculated by Alan Wyatt for systems with meters at the property line. This was not clearly stated in Alan Wyatt’s presentation to the IWA Performance Indicators group in November 2023 and may be unintentional but it’s a fact.
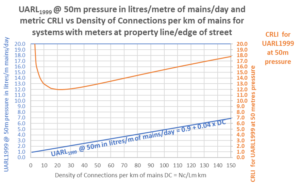
- Lt in m3/km of mains/day has the same numeric value as litres/metre of mains per day (e.g. 1.8 litres/metre of mains/day equals 1.8 m3/km/day), and the Amsterdam CRLI paper uses both units interchangeably to some extent. DC should therefore always be clearly specified (20 connections per km mains is only 0.02 connections per metre of mains), rather than simply stating ‘density of connections’ without units. Adjustment factors of 31.62 (the square root of 1000) or 0.03162 (the square root of 0.001) therefore sometimes need to be included when calculating CRLI. Two simple fast way to calculate CRLI at unknown average pressure are:
- CRLI = 0.0316 x Lt in litres/connection/day x SQRT (DC in conns/km) ……(1)
- CRLI = 31.6 x Lt in m3/km mains/day ÷ SQRT (DC in conns/km) ….………(2)
- In graphical format, Equations 1 and 2 above show that CRLI at 50 metres pressure is not independent of connection density. CRLI reaches a minimum of 12 at 22.5 conns/km – further confirmation that it is based on the UARL equation. CRLI is between 12 and 13 units at 10 to 50 conns/km, but rises rapidly at lower connection densities (15 units at 5 conns/km) and higher connection densities (CRLI = 15 units at 100 conns/km, 20 units at 200 conns/km, 25 units at 300 conns/km).
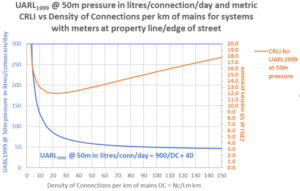
- Note from Graph 1 above that UARL1999 at 50 metres pressure is very stable at 50 litres/connection/day +/- 10% for connection densities between 60 and 175 per km mains; over this range the UARL in litres/connection/day is approximately the same as average pressure in metres, what could be simpler? In contrast CRLI increases by 40% (13.5 to 18.8) over this same range of connection densities, so why would you prefer to use CRLI as a KPI, which unfairly penalises systems with a high connection density?
- A question asked at the Amsterdam IWA Performance Indicators Group meeting was “what does CRLI mean?” and we have personally enjoyed researching and gaining a better understanding of CRLI and geometric means. The power of free exchange of views between international members of the Water Loss Specialist Group works yet again. Our sincere thanks to Alan for his initiative in trying something new for systems which don’t know their average pressure.
- We endorse the IWA WLSG Prague Recommendations that the ILI should be used for benchmarking and should be interpreted with some measure of pressure; these recommendations stimulated us to take a fresh look at ILI and average pressure relationships and to see if we could also include setting targets as an average daily volumetric rate.
- We believe that we have now found a way to estimate combinations of Average Pressure and ILI (using World Bank Institute Bands A-D, developed by Roland Liemberger in 2005), for any system where we currently don’t have or can’t calculate either one, because of people’s lack of pressure data or concerns regarding estimates of average pressure. This methodology applies irrespective of the location of the meter on the service line. We can also calculate the leakage volume target required to meet specific values of ILI. We are currently testing this methodology for large systems and will publish further information in due course.
- One word of caution – the UARL1999 equation was developed by the 1st IWA Water Loss Task Force for large systems at mid-range pressures. With 25 years research, it is now recommended only for systems with more than 5000 service connections and pressures between 45 and 60 metres; so CRLI calculations, being based on UARL1999, should be limited to that range. However, for systems outside these boundary conditions, UARL with System Correction Factor (SCF) has been recently developed, and that can be substituted for UARL 1999 .