ILIs in the Netherlands 2015
The Netherlands has, for several decades, had a well-deserved reputation for management of Non-Revenue Water (NRW) and Real Losses in public water distribution systems. The ten Netherlands’ Water Utilities which constitute the Vewin association are responsible for the quality and quantity of continuous supplies to more than 17 million people. Both Vewin and the Human Environment and Transport Inspectorate (ILT) of the Ministry of Infrastructure and the Environment, the regulator of all ten Utilities in the Netherlands, publish figures for leakage (up to customer meters) in various units, but not yet in terms of Infrastructure Leakage Index (ILI), which is the IWA recommended performance indicator for technical comparison of leakage management.
However, using publicly quoted information in the report Prestatievergelijking drinkwaterbedrijven 2015 (© ILT, November 2016) – available in Dutch language only – sufficient information is available to provisionally assess the ILIs of Netherlands’ Utilities. It is also a particular pleasure to do this, as the Netherlands ILI data has one of the lowest overall figures for a complete country data set yet published on the LEAKSSuite website, confirming the Netherlands standing as one of the world leaders in water loss management.
As NRW has always been relatively low, until recently the Netherlands’ Utilities didn’t make any deduction for Unbilled Authorised Consumption (e.g. water from fire hydrants or for flushing) and Apparent Losses (illegal connections, theft of water and customer metering inaccuracy) when calculating Real Losses, so NRW and water losses are almost wholly Real Losses.
The Table below shows the range of infrastructure, pressure and Real Losses KPIs assessed from available published data. Note that as the number and average length of service connections are not available in the ILT data, number of underground service connections has been assumed to equal number of properties, and average service connection length assumed as 4 metres (probably an under-estimate, and likely to vary between urban and rural Utilities). The authors of this note are interested and willing to discuss and improve the reliability of these KPI calculations with any individual Utility; meanwhile individual Utilities are not named, and calculated KPIs are provisional.
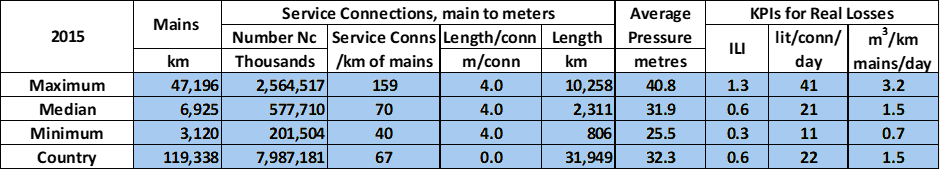
As the connection densities for all ten Utilities significantly exceed 20 per km of mains, it is probable that, with usual IWA assumptions, more than half of the Real Losses annual volume will be occurring on service connections rather than mains. If this is the reality, litres/connection/day is likely to be preferable to m3/km mains/day for target-setting and tracking progress in Real Losses, because of the wide range of connection densities.
The Infrastructure Leakage Index (ILI) was designed by the 1st IWA Water Loss Task Force for technical comparisons of leakage management performance, and published in 1999. The ILIs and average pressure for each of the Netherlands’ Utilities are shown in the chart below.
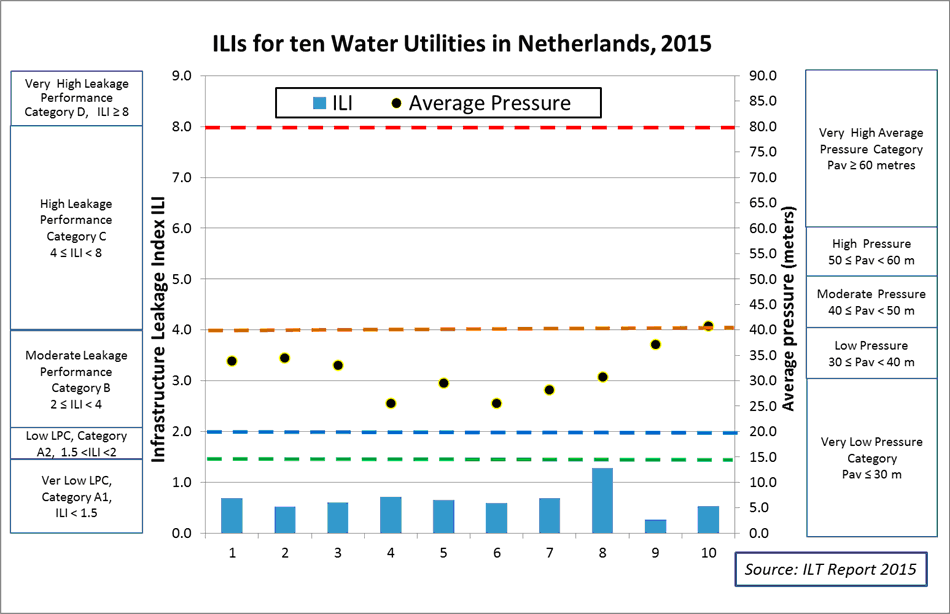
Leakage Performance Categories (LPC) next to the left side axis, and Average Pressure Categories next to the right side axis, are as recommended in the EU Reference document ‘Good Practices on Leakage Management’ (© European Union, 2015). See the Table at the end of the UARL&ILI webpage for further details on Leakage Performance Categories.
All ten Netherlands’ Utilities have ILIs within Category A1 (ILI < 1.5); and nine Utilities have ILIs less than 1.0, meaning they are achieving lower Real Losses than calculated using the 1999 standard international equation for Unavoidable Annual Real Losses (UARL) which is recommended in the 2015 EU Reference document. Possible reasons for this are worthy of mention.
It is recognised that ILIs less than 1.0 can occur in some situations, for example in very small stand-alone Austrian Utilities systems with fewer than 3,000 services, but all Netherlands’ Utilities have at least 200,000 service connections.
Distribution systems in which almost all leaks are reported/visible (or identified and repaired very quickly) due to very small district metered areas, impermeable ground conditions, high quality materials and craftsmanship of contractors, well-thought design of infrastructure and detailed monitoring of water distribution can also achieve ILIs less than 1.0, and various of these aspects combined with the laying of mains in cycle tracks (rather than in roads) in the Netherlands seems likely to have had this effect.
The 2015 EU Reference document clearly identifies reduction of excess pressures as the foundation for successful implementation of other complementary leakage control strategies. Pressure management has been actively promoted in the Netherlands Utilities’ strategies. The average operating pressures range from 25.5 to 40.8 metres, with five Water Utilities in the ‘Low’ category and four in the ‘Very Low’ category. Netherlands’ Utilities certainly understand that, for effective pressure management of leakage, ‘every metre counts’. At ‘Low’ and ‘Very Low’ average operating pressures, with flexible pipe materials, the calculated Unavoidable Background Leakage component of the UARL equation (used in the calculation of ILI) needs to be reduced by more than the usual simple assumption of a linear pressure:leakage relationship. Burst frequencies also reduce at lower pressures, and repair frequencies in this group of Utilities are also likely to be lower than the repair frequencies for mains, and for services, which are assumed in the standard UARL formula at 50 metres pressure. However, the authors of this note do not at present have access to Netherlands’ Utilities data which would permit further investigation
These assessments of ILI from publicly available Netherlands ILI data by Allan Lambert of Water Loss Research & Analysis Ltd (UK) and Cor Merks (the Netherlands), and comments on the results, do not purport to represent the opinions or policies of any of the Netherlands’ Utilities, Vewin or ILT. The data is presented with the sole intention of demonstrating to other countries the very high standard of leakage management in the Netherlands, using the ‘Fit for Purpose’ ILI performance indicator.
Countries which already have sufficient good quality ILI data to justify a separate Webpage within the Global ILIs Library are invited to contact https://www.leakssuitelibrary.com/contact-us/