Good leakage calculations need AZP pressures
Why AZPs are needed, and how to establish them
Many key aspects of leakage analysis, calculations, concepts and predictions use measurements of both flow and pressure in discrete distribution zones to track and calculate leakage from night flow measurements. Management of excess pressures and transients is also now increasingly used internationally to reduce leak flow rates and new burst frequencies, and extend asset life. Pressure usually varies within Zones, but most Utilities don’t yet recognize any need to measure pressure for these types of predictions and calculations at a meaningful representative location for average pressure – the Average Zone Point AZP (not the inlet, and not the critical point).
Investment costs for different pressure management options, and benefits for individual zones, both vary widely. Reliability of most calculations and predictions for targeting activity and investment can be improved and simplified using AZP pressures, at relatively low cost. Establishing an AZP for each Zone is one of the best, easiest and cheapest investments in zonal leakage and pressure data collection that a Utility can make – so why don’t more do so?
Broadly speaking, a 10% reduction in Average Zone pressure can be expected to reduce leak flow rate by between 5% and 15% (depending on the ratio of fixed and variable area leaks), and a reduction of between 0% and 25% in new burst frequency, depending upon current burst frequencies for mains, and (separately) for service connections in the zone. To a significant extent, each Zone has its own characteristic pressure variations, and its own optimal pressure management solution. Successful concepts and analytical techniques have been developed to track fluctuations in average zonal pressure, allowing practitioners to predict individual zonal benefits and to refine zonal leakage calculations. However, as these concepts and models are based on AZP pressure measurements, the predictions and calculations will not be valid unless AZP pressures are used.
Currently, many Utilities consider the establishment of an Average Zone Point and AZP pressure measurements as an unjustified luxury, and continue to base their leakage calculations, operational pressure management, and pressure management investment decisions on pressures measured at, or derived from, the zonal inlet point or critical point. In some circumstances, the results may be acceptable, but in others highly erroneous. Most academics and some practitioners consider that defining and using an AZP point is too crude an approach, and prefer to use network analysis models, so practitioners often have to use or try to adjust whatever pressure data happens to be available (usually zonal inlet pressure) for their calculations or research.
This Average Zone Point Webpage explains:
- why Utilities should identify an AZP for each Zone (whether pressure managed or not)
- which leakage calculations are more reliably based on AZP pressures
- how to define an AZP point, from the simplest to more complex methods
- how to use a systematic methodology used to define the AZP, with an audit trail
Why should Utilities identify Average Zone Points?
The starting point is to agree that there is no single unique point in a distribution Zone which will continuously experience the exact average zone pressure at all times. The objective is to define a field measurement point for pressure, using a systematic auditable method, which will provide a reasonably good practical approximation of the continuously varying profile of average zone pressure, for a range of pressure-related leakage calculations.
One of the worst (but unfortunately frequent) assumptions for estimating average zonal pressure, found in some references, is to assume that the average zone pressure is the Inlet pressure, or the Critical Point pressure, or an average of both, sometimes adjusted for differences in ground level and sometimes adjusted with assumed fixed frictional losses.
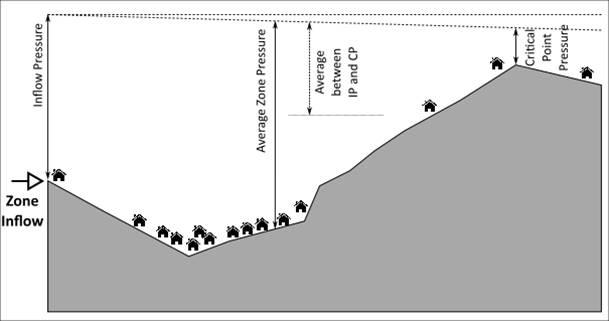
Although these may not be unreasonable assumptions for a small zone with negligible variation in ground levels and minimal frictional head loss within mains, Figures 1 and 2 show two common situations that will lead to significant errors in estimates of average zone pressure, even at night, if inlet and/or critical point pressures are used as a substitute in calculations of pressure: leakage and pressure: burst frequency relationships.
Figure 1: Ground level slopes away from inlet, Critical Point close to Inlet
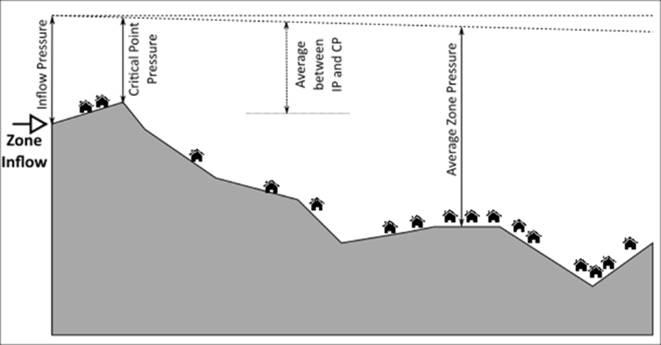
Figure 2: Ground level slopes upwards from inlet, Critical Point distant from Inlet
Acknowledgement: Roland Liemberger
Network models can also be used to predict average nodal pressures for particular scenarios and assumptions, and have an increasing part to play in future in validating the reliability of physical measurements at AZP points. However, such models are not always available, or as easily maintained and operationally accessible to leakage practitioners as direct pressure measurements.
The comparison with medical practitioners taking blood pressure is relevant. Blood pressure measurements are always taken according to a protocol at a specified location – the upper arm, adjacent to the heart (not the neck, and not the ankle!) so that they can be consistently and rapidly interpreted in simple terms. Systematic errors are avoided, and small random variations between successive measurements can be tolerated.
Leakage calculations requiring measured AZP pressure
Table 1 provides an overview, based on current practical experience, of the relative importance of measured AZP pressures for different leakage calculation purposes. Each of the types of calculation in the Table is then briefly discussed.
Table 1: Relative importance of measured AZP pressures for various calculations
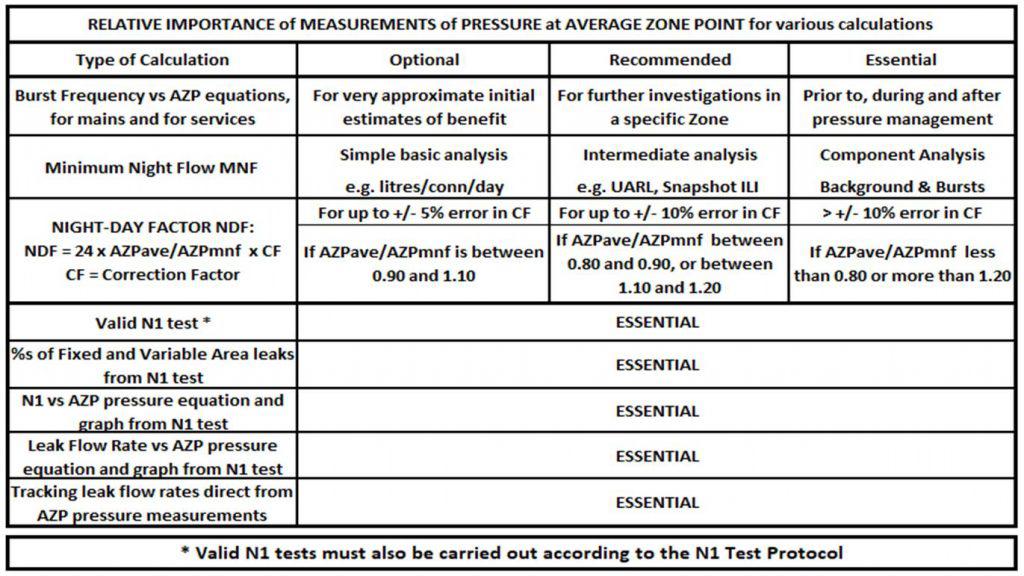
- Burst frequencies on mains and on services require separate analyses, as they usually respond differently to pressure management. Depending upon local conditions, a 10% reduction in AZPmax can reduce new burst frequencies by between zero and 25%. Predictions are very sensitive to values of maximum AZP pressure.
- Minimum night flow: the leakage component of minimum night flow varies with AZP pressure, to a greater or lesser extent depending upon the relative proportions of variable area and fixed area leaks. A 10% reduction in AZPave can reduce leak flow rates by between 5% to 15%, and is particularly effective for reducing undetectable background leakage at joints and fittings. Reliable predictions based on component analysis require an N1 test with AZP pressure measurements.
- Night-Day Factors: These are used to convert minimum night flow to daily average flow, allowing for hourly fluctuations of Average Zone Pressure. Recently improved and simplified NDF calculations require measurements of AZP pressure to define the ratio of average daily pressure at the AZP (AZPave) divided by AZP pressure at the time of minimum night flow (AZPmnf). If AZPave/AZPmnf is outside the range 0.9 to 1.1, N1 tests are recommended when calculating Night Day Factors. If carried out correctly to a strict protocol including AZP pressure measurements, they can be used, with Fixed and Variable Area Discharge (FAVAD) concepts, to:
- calculate the %s of fixed and variable area leaks at the time of the N1 test
- define the equation relating N1 to AZP pressure for the Zone
- define the equation relating the leak flow rate to the AZP pressure
- define the Night-Day Factor more reliably when AZPave/AZPndf is <0.9 or >1.1
How to define an Average Zone Point
It is necessary to restate here that the concept of an Average Zone Point is an approximation in itself, as there is no single point in a distribution zone that can exactly represent the average zonal pressure 24/7 and 365 days per year. However, that is not a sufficient reason for failing to take care in identifying an AZP point, or for relying on measured pressures at inlet or critical point that are much less reliable estimates of average zone pressure.
The simplest definition of Average Zone Point is ‘A point where the pressure variations are supposed to be representative of the Zone as a whole’. As the AZP pressure is to be used for leakage calculations, the above definition can be extended to
‘A point where the pressure variations are supposed to be representative of the pressure variations influencing the sum of leak flow rates in the Zone as a whole’.
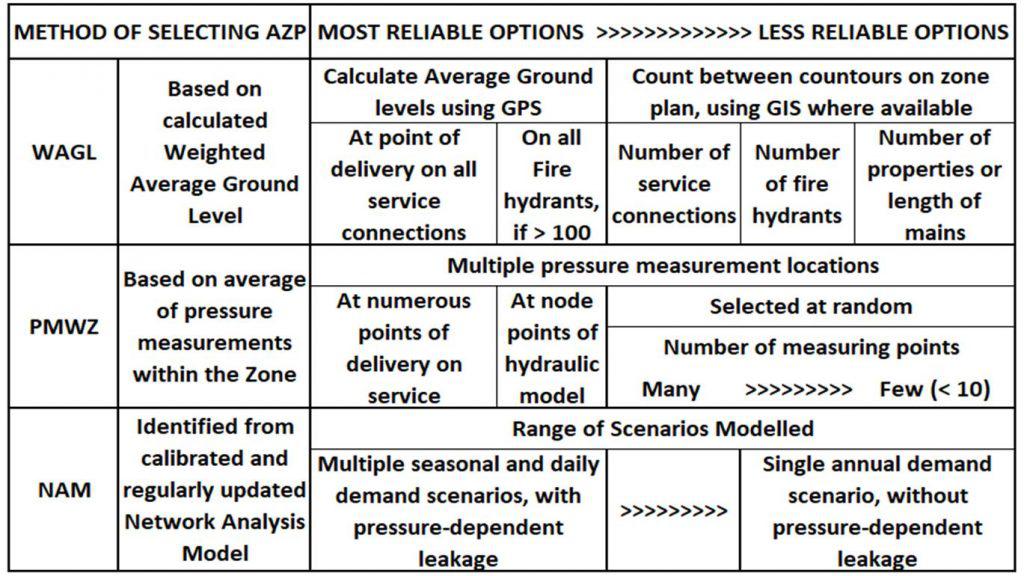
Three systematic auditable methods for defining an Average Zone Point are shown in Table 2. The methods can be used individually, or in combinations, depending upon available data and technology, to cross-check if the AZP location method selected by one method is reasonably consistent with the AZP location checked later by an alternative more complex method.
Table 2: Three methods for systematic and auditable selection of Average Zone Points.
For example, if several pressure loggers are being temporarily located at different points in a Zone, it would be logical to put one of the loggers at an AZP identified earlier by a simple method.
Simpler methods will often be adequate for smaller zones with low frictional head losses and little variation in ground levels. Larger zones with greater variation of ground levels should benefit from the more detailed evaluation methods.
Identifying AZP using Weighted Average Ground Level (WAGL) Methods
There are several weighting parameters that could be used to assess the weighted average ground level where pressure variations are supposed to be representative of the pressure variations influencing the sum of leak flow rates in Zone as a whole. Table 2 identifies service connections, or hydrants, or properties or mains, and each may result in a different weighted average ground levels for selection of the AZP point.
Most practitioners prefer to use the average ground level of service connections in the public highway at the ‘point of delivery’, as in well managed systems the greatest proportion of annual leakage is generally associated with leaks on the service connection up to that point, where the customer meter is often located, and where the minimum standard of service for pressure is usually defined.
Using Global Positioning Systems (GPS), ground levels can be identified for every service connection (at the point of delivery) and hydrant. The cost of using GPS will vary depending upon the height accuracy required. The data are then used to determine the average ground level of the selected type of infrastructure within the Zone. If the Zone is large enough to include more than around 100 hydrants, then hydrants may be the simplest option to use for this calculation.
If GPS data or hydrant ground levels are not available, Geographic Information Systems (GIS) can be used to allocate heights to points between contours using methods such as a Digital Terrain Model (DTM), preferably with a Triangular Irregular Network (TIN). If GIS is not available, counting infrastructure items between contours is an alternative approach, using a plan of the zone distribution systems with contours superimposed.
The following slide sequence outlines the method, and Table 3 shows the calculation, based on hydrants, to demonstrate the process.
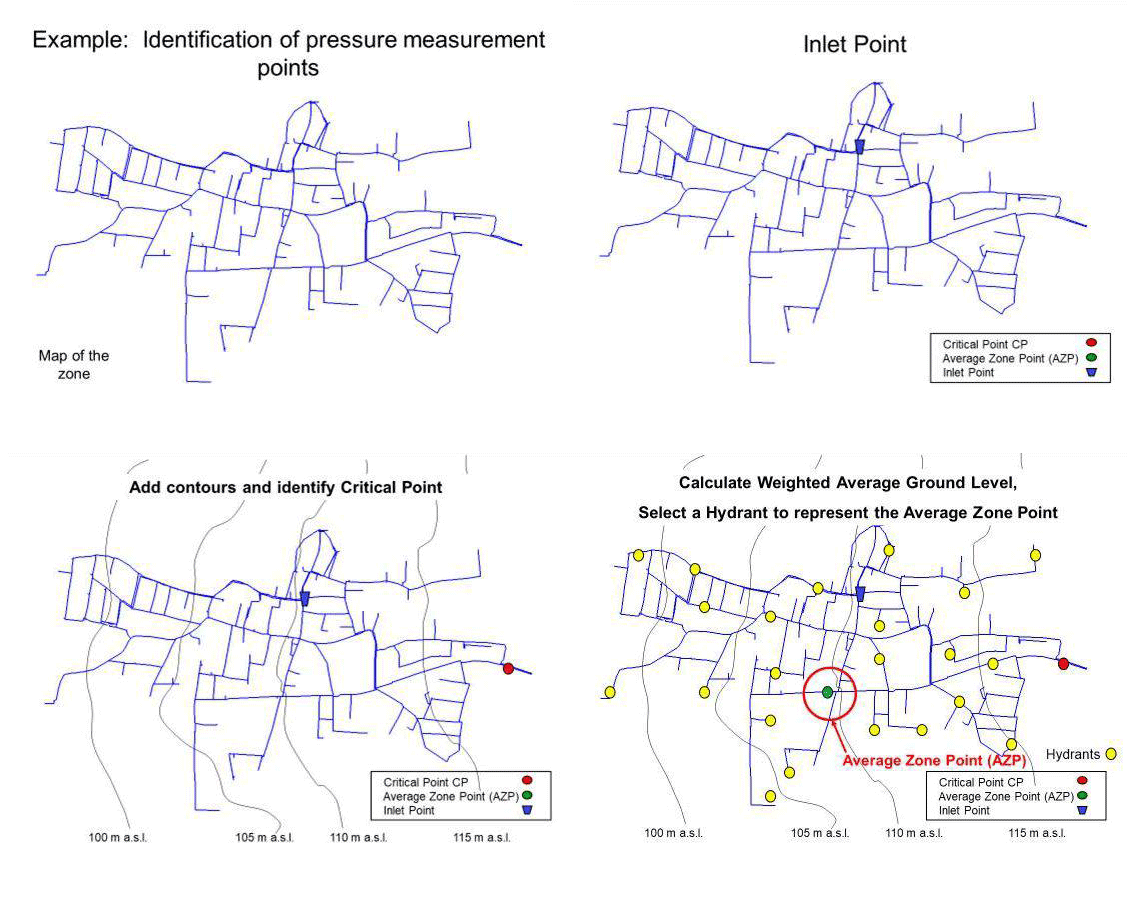
Acknowledgement: Dr Marco Fantozzi
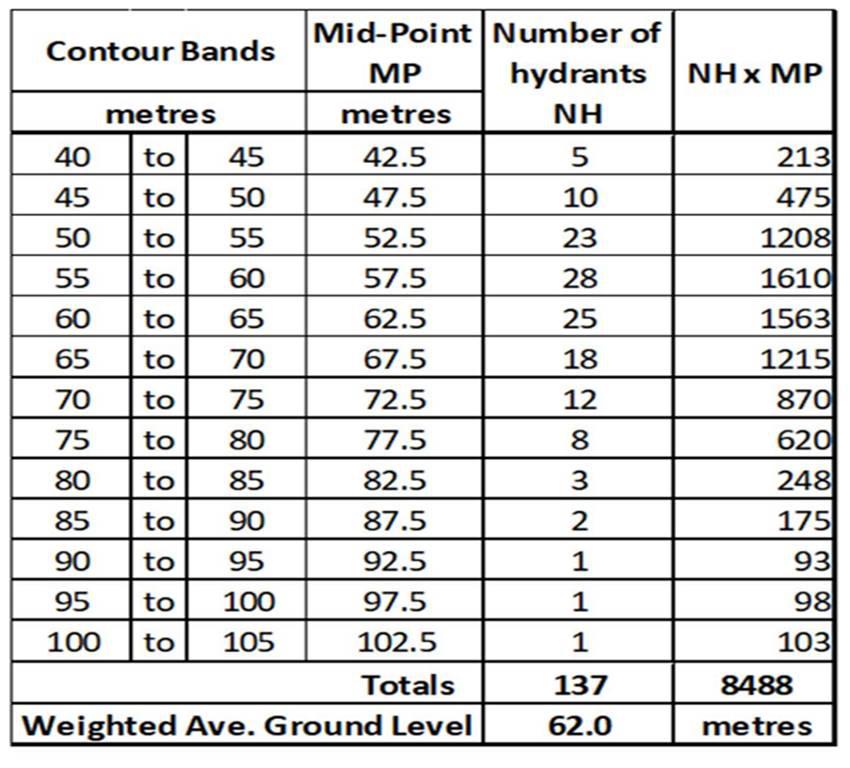
The number of hydrants (NH) between each pair of contour bands are counted, and multiplied by the ground level at the mid-point of the two contour bands (MP), then the individual NH x MP values are added and divided by the total number of hydrants to get the weighted average ground level.
Table 3: Example of Weighted Average Ground Level calculation using Contour Bands
Then select a hydrant to represent the Average Zone Point for field measurements. The selected hydrant location should be near the mid-point (rather than the edges) of the Zone, preferably on mid-sized mains, so that frictional head losses up to the AZP are likely to be reasonably representative of average Zone conditions.
As it is unlikely that there will be a mid-Zone hydrant with ground level exactly equal to the calculated WAGL, select a mid-Zone hydrant with the closest ground level to the WAGL and apply an appropriate fixed offset (+/-) to all measurements at the AZP point.
Remember also that, when measuring pressure at a hydrant representing the AZP, it will be necessary to add the length between the logger and the pipe level (or ground level, according to preference).
Identify AZP from Pressure Measurements Within Zone (PMWZ) Methods
Smart metering technology now makes it feasible (but not economic or possible for all Utilities) to measure and transmit pressure at every individual service connection in a Zone. Some tests have recently been carried out on this basis to continuously calculate average zone pressure. While such measurements might be used for tracking fluctuations in average zone pressure on a continuous basis, the data management implications for real-time operational purposes would be huge. However, such a time-limited study could provide, as a by-product, valuable data for identifying suitable locations for AZP points.
If weighted average ground levels cannot be calculated because no contour maps are available, a limited number of pressure loggers could be located, for example at node points of a hydraulic model of the Zone (if such a model exists), or at randomly selected hydrants, to record concurrently, preferably for 7 days. The average pressure at each hydrant, and for all of the hydrants, can then be calculated, and the hydrant which best represents the average of the sample measurements can be selected as the Average Zone Point (keeping in mind the ‘Zone mid-point’ and ‘mid-size mains’ criteria above).
Identify AZP using Network Analysis Model (NAM) Methods
An offline calibrated network analysis model calculates average nodal pressure in a simulation of different situations, but many currently available network analysis models may not be able to reliably replicate the operation of flow modulated and time modulated pressure managed Zones, allowing for pressure-dependent leakage. Also, the calculation of pressure may only be available at a limited number of Nodes.
Network Analysis Models should be able to identify if the critical point in a Zone occurs somewhere other than the service connection in the zone which is sited at the highest ground level. However, the purpose of defining an AZP point is to assess average pressures profiles in the Zone, rather than critical pressure profiles. If a node of the hydraulic model coincides with the location of the AZP, it may be possible to compare the two estimates of average zone pressure, for a given set of assumptions. If the hydraulic model zonal pressures are also weighted then comparisons with measured AZP profiles should be possible.
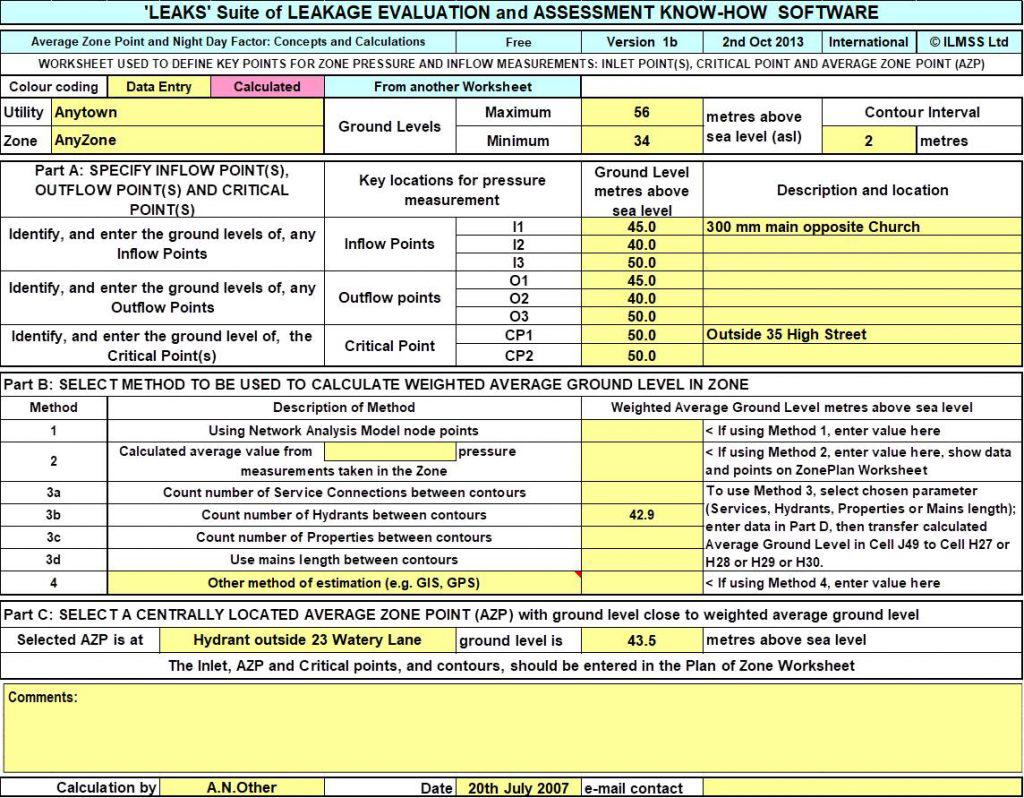
Recording the systematic methodology used to define AZP, with audit trail
The following Worksheet is an example of an audit trail to record the methodology used to identify an AZP point. Failure to record this key information properly usually results in new personnel not realising that an Average Zone Point has already been defined for each Zone, or how and why the AZP was chosen, or why the calculations of Average Zone Pressure are being done at all. This happens – all too frequently, unfortunately – and can be avoided.
Acknowledgements: Thanks to Roland Liemberger and Dr Marco Fantozzi who provided feedback and helpful comments on the previous draft of this webpage, and to Roland Liemberger for permission to use Figures 1 and 2.