Overviews of Leakage by Country using reported ILI data
Although IWA Water Balance and Best Practice Performance Indicators have been widely adopted internationally since publication in 2000, after 17 years there has been little real progress in international reporting of leakage management performance. At the recent IWA Performance Indicators Conference (May 2017, Vienna), one of the opening statements was ‘Everyone knows %s of System Input Volume must not be used for target-setting and/or making technical comparisons’. Yet international funding agencies, regulators and Indices such as Sustainable Cities Water Index and Dow Jones Industrial Index continue to request, publish or use that discredited measure almost exclusively for both these purposes.
The many reasons why % of SIV should not be used as a measure of leakage management efficiency can be found in the KPIs section of the LEAKSSuite Library.. This Note discusses how to use increasingly available sample data sets of Infrastructure Leakage Index (ILI), the KPI developed by IWA for comparison of technical performance of individual Utilities, to give a broader overview of leakage management performance of multiple Utilities in a Country or State. The Table, Notes on data sources, and Chart below use ILI data mainly from Global ILIs for discussion purposes.
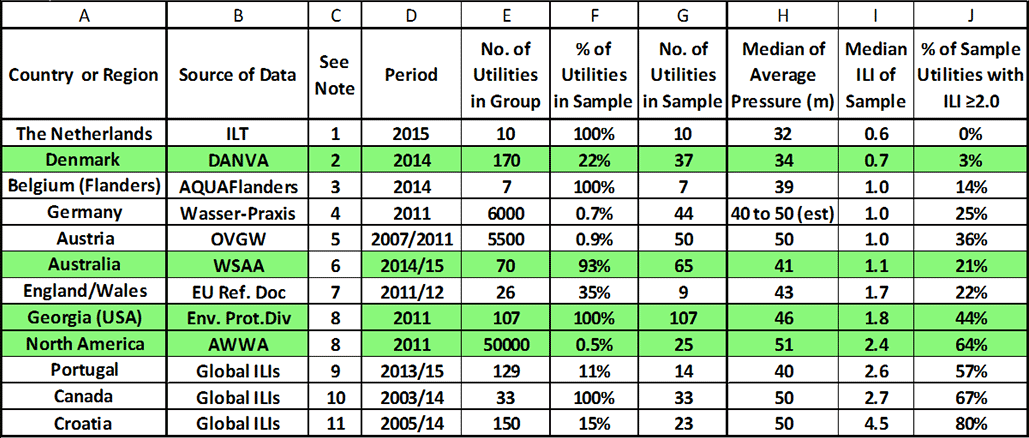
In the 12 international data sets in Table 1 below, columns A to G show that the number of Utilities from a Country or Region providing reported ILI data range widely, from 100% for the Netherlands (10 out of 10) and AQUAFlanders (7 out of 7), to 25 out of 50000 (0.5% of total) for North America. Countries and Regions where published ILI data are attributed to individually named Utilities are shown in green; this practice should be encouraged. Brief notes on the sources of data are shown below Table 1.
Table 1: Overview of ILI sample data from 12 Countries and Regions
Brief Notes on Sources of Data for the above Table
- Provisional assessment
using publicly available data from Human Environment & Transport
Inspectorate, Ministry of Infrastructure & Environment of the Netherlands
(© ILT, Nov 2016) - Derived from Water in
Figures 2015, DANVA Benchmarking - Based on data provided by
AQUAFlanders - Derived from Fig.11 of
Article in Energie: Wasser-Praxis, 10/2012, pages 34 to 41 - From data provided by OVGW
for systems with < 10k conns - National Performance
Report, Utilities > 10k properties - ILI data for 9
England/Wales Utilities in European data - Georgia Environmental
Protection Div. > 10k population. - Data mainly from Utilities
in iPerdas initiatives - Data from various Utilities
and Consultants in Canada - Data from various sources
in Croatia by J Kovac
In seeking an overview of any relatively small set of sample data, to assess the performance (by implication) of a Country or Region, it is essential to remember that:
- probability distributions of ILI may show a marked lack of symmetry, with clustering at lower values, and a few very high ILIs strongly influencing the average value.
- sample data may be self-selected; Utilities with high ILIs may not voluntarily supply data
- Utilities vary greatly in size, so weighted averages from small samples may be unrepresentative
- it is easier to achieve lower ILIs in very small Utilities (less than 3000 service connections) as new leakage events are more easily identified from night flows
- although ILI already allows for a linear (N1) relationship between average pressure and leak flow rates, lowering maximum pressures and reducing pressure transients also reduces new burst frequency, so it is useful to show average pressure alongside ILI, to indicate potential for pressure management to reduce burst frequencies and extend asset life.
For the reasons stated above, the median values (exceeded 50% of the time) of average pressure in Column H, and ILI in Column I, are likely to be more representative central values of the Group than the arithmetic averages of the sample data.
As a simple indicator to assess broad opportunities to further reduce leakage for samples of Utility ILIs, and (by implication) for the whole of the Group, the % of the sample Utilities with ILIs of 2.0 or more (Leakage Performance Categories B to D) for High Income Countries), shown in Column J, could be used. Any Utility with an ILI of 2.0 or more would be losing at least twice the Unavoidable Annual Real Losses (UARL) for their system at the current operating pressure.
The two parameters which are used to give an overview of the sample data – median ILI and % of sample Utilities with ILI ≥ 2.0 – are shown in the bar chart below.
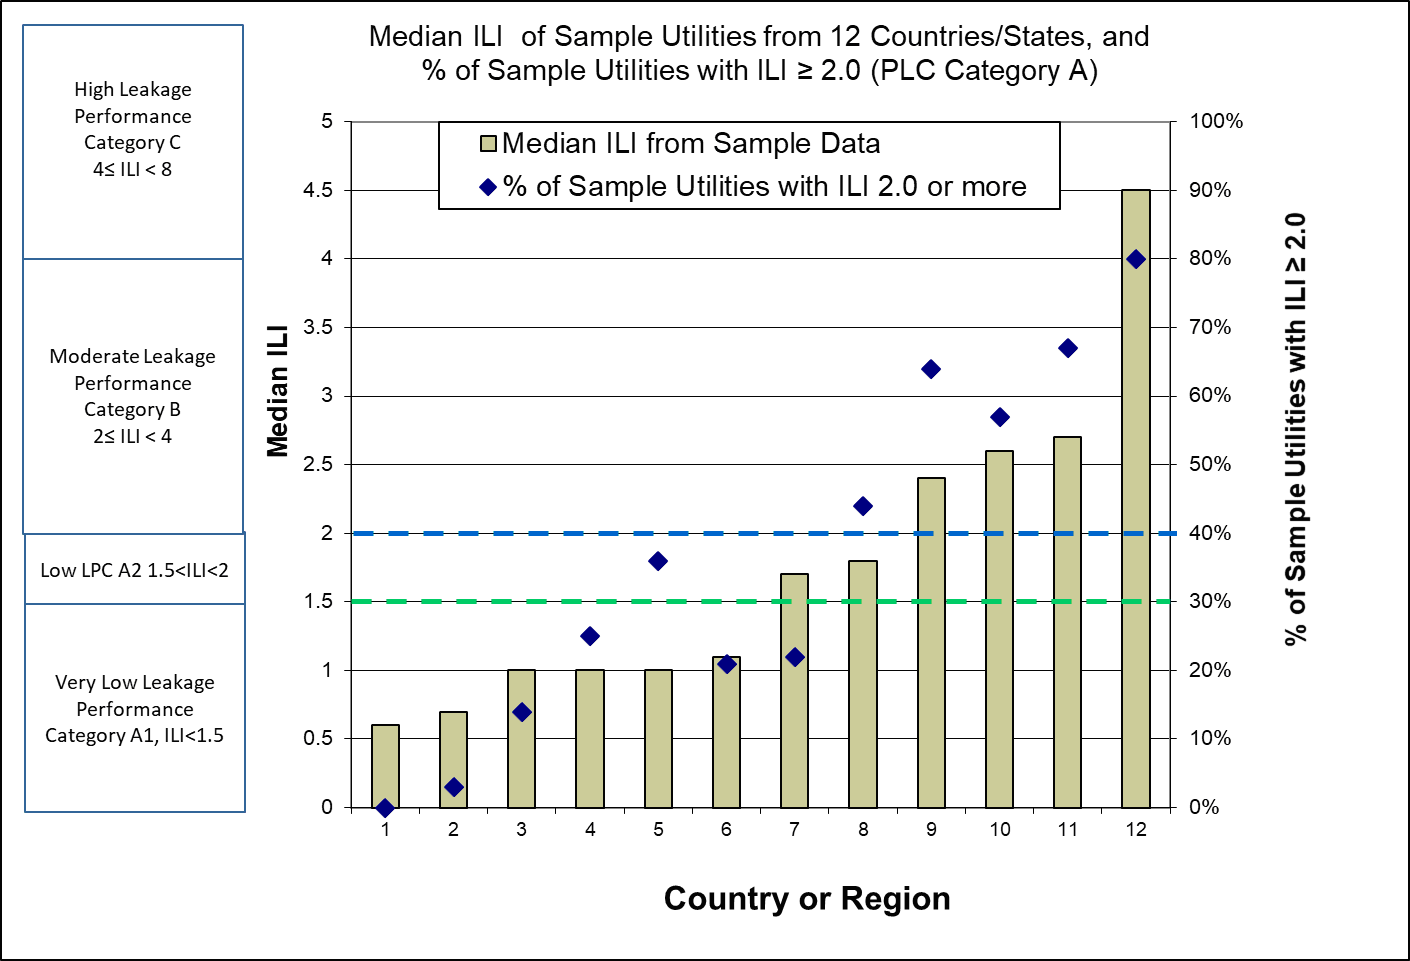
In general, as the median ILI in the sample increases the % of sample Utilities with ILI ≥ 2.0 would be expected to increase. However, the two indicators should be considered together, for example:
- Country 6 sample median ILI is 1.0, but 37% of the sample Utilities have an ILI ≥ 2.0
- Country 7 sample median ILI is 1.7, but 21% of the sample Utilities have an ILI ≥ 2.0
Regarding the ILI data used for the purposes of this discussion, readers are asked to keep in mind that many countries have been making good progress in leakage reduction in recent years, and the ILI data used in this note may not be representative of current (2019) performance