ILIs in Australia 2014/15
The Water Services Association of Australia (WSAA), which represents the interests of the urban water industry, adopted the IWA Standard Water Balance and published an initial set of ILIs in WSAAfacts 2004. During the next 8 years of extreme drought, almost all Australian Water Service Providers (WSPs) had to use every means at their disposal, including recycled water, restrictions, intensive active leakage control and pressure management to reduce leakage in order to sustain water supplies.
The information in this Webpage was obtained from the National performance report 2014–15: urban water utilities published by the Australian Government Bureau of Meteorology; at http://www.bom.gov.au/water/npr/ . National Performance Reports prior to 2013-14 were published by the National Water Commission (NWC). The Reports name and identify each individual WSP, a practice which sets a fine example to other countries which do not currently do so.
The calculated ILIs for 2014-15 for 65 WSPs in the chart below, classified by number of properties (minimum 10,000), had been independently audited before appearing in the NWC Report. Further cross-checking of data suggests the presence of just a few anomalous results, and two of these have been omitted from the data set presented here. For the purposes of the Global ILIs webpage, ILIs have been classified using international Leakage Performance Categories A1 to D shown at the left hand side of the graph, see ‘UARL and ILI‘ section of the LeaksSuite Library.
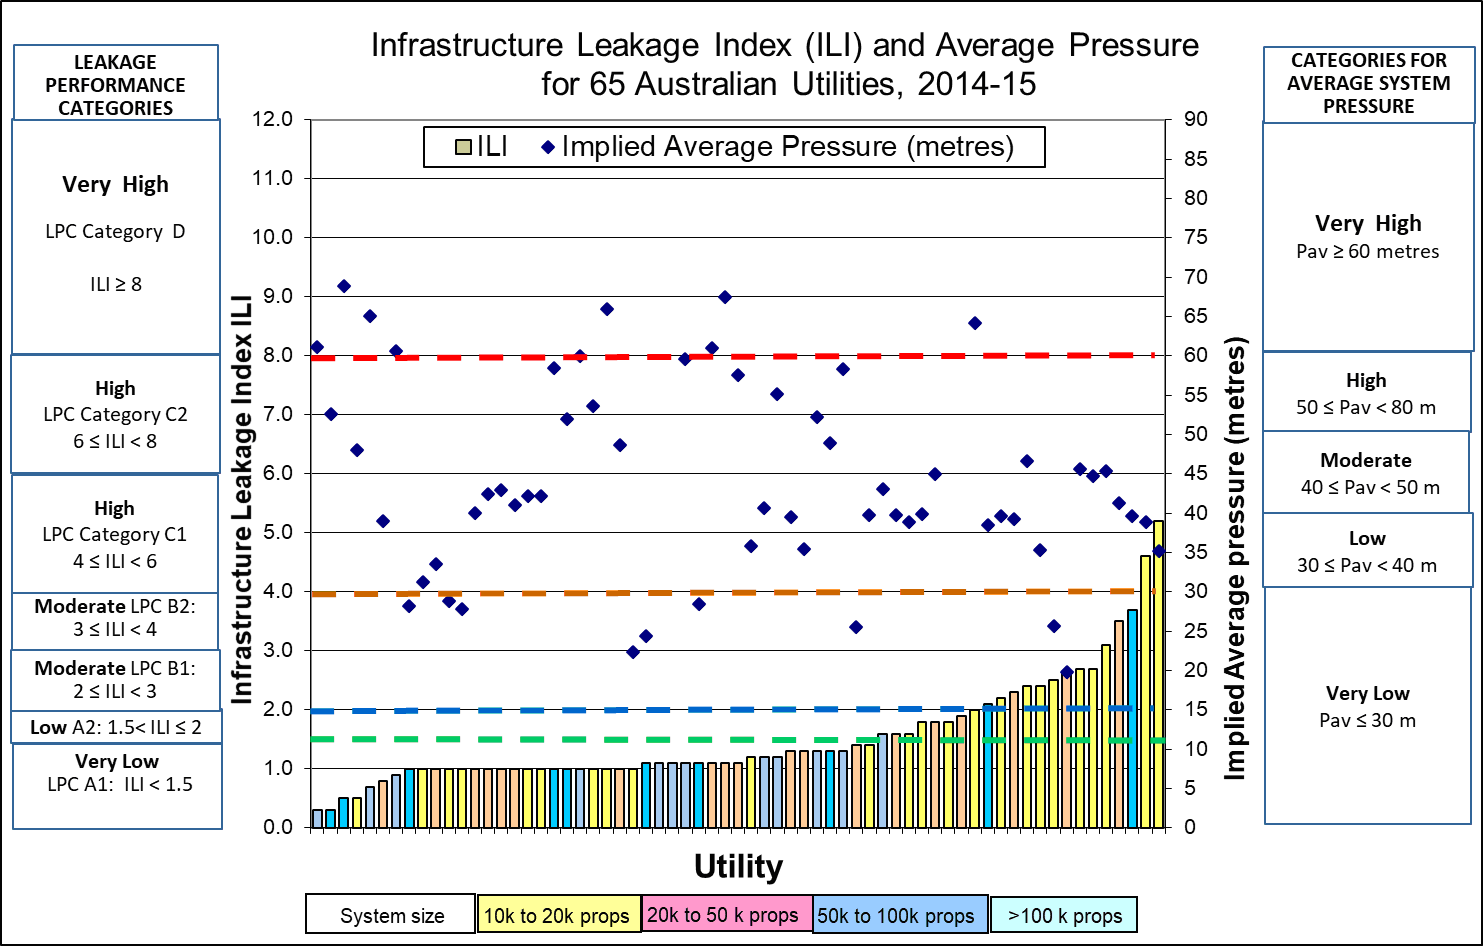
Two-thirds of the WSPs have achieved ILIs of 1.5 or less, which is an excellent performance by international standards, and 77% of WSPs have ILIs within LPC Band A (Further loss reduction may be uneconomic unless there are shortages). It is notable that almost all of the WSPs with more than 100k properties have achieved an ILI less than 1.5, which is in the ‘Very Low’ category.
In order to calculate the ILI, WSPs must assess average system pressure, which is currently not quoted in the published NWC data. This is a pity, as water pressure is an essential key parameter for leakage specialists to interpret leakage and bursts data, just as meteorologists need synoptic charts of air pressure to interpret weather data.
Water pressure significantly influences burst frequency on mains and services. Background (undetectable) leakage which accounts for more than half the annual volume of leakage in most Australian WSPs is very sensitive to pressure. Extensive installation of many hundreds of additional Pressure Reducing Valves, targeted to reduce leak flow rates and burst frequencies on mains and service connections, played a major part in management and reduction of leakage during the latter part of the millennium drought.
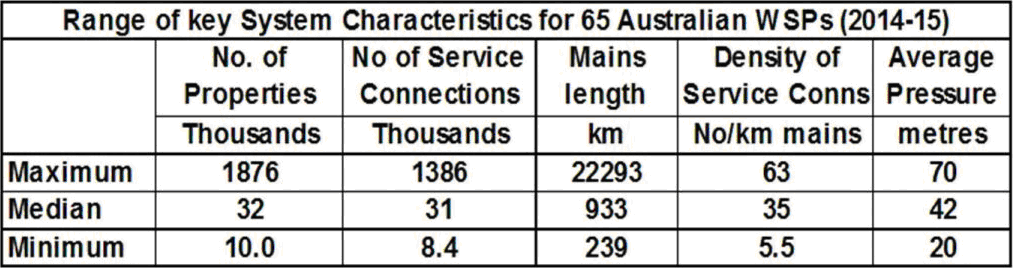
Although average pressure is not published in the NWC Reports, as part of a WLR&A Ltd secondary quality control process of the published data it is possible to assess the implied average pressure for each WSP to within about +/- 3 metres. These implied average pressures are also shown in the chart above, and range from 20 to 70 metres. The range of key system characteristics is shown in the Table below.
The Australian ILI data set, with so many ILIs close to 1.0, despite the wide diversity in the above key system characteristics, strongly supports the general validity of the UARL equation, which was first published in 1999 to predict ‘how low could you go?’ ten years before such low leakage levels were being achieved in Australia, towards the end of the Millennium drought. In a limited set of circumstances the calculated real losses may be less than the UARL (resulting in ILIs less than 1) but WSAA Guidance in the millennium drought recommended that ILIs less than 0.7 should always be double checked for possible calculation errors. It is not known if this double check has been carried out before the 2014/15 data were published.
In Australian National Performance Reports, litres/service connection/day is currently used for both tracking and comparing leakage management performance of Australian WSPs. The recent EU Reference Document ‘Good Practices on Leakage Management’ confirmed that litres/connection/day is recommended for tracking performance in individual systems. However, it also confirmed that ILI – not litres/service connection/day – should be used for technical performance comparisons between different systems because of widely different key characteristics (density of connections, length of service connections main to meter, average pressure).
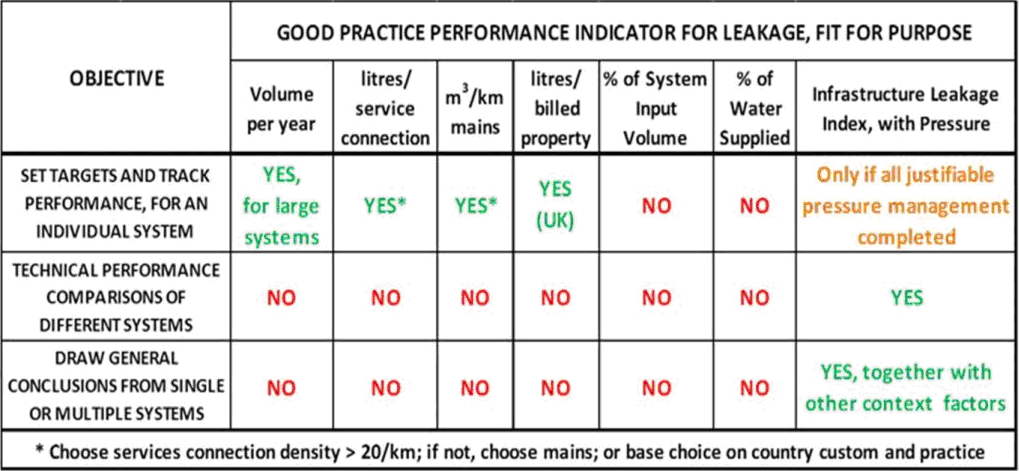
The ILI was specifically developed by the IWA Water Loss Task Force in 1995-99 for national and international comparisons of technical leakage management at current system operating pressure. ILI is being calculated but not currently promoted in Australian National Performance Reports for the purpose it is designed for – national and international comparisons – which is a pity because it clearly shows an outstandingly good performance for a large country with diverse system characteristics. It’s not only necessary to calculate the most appropriate performance indicators, but also to use them for the most appropriate purposes (see ‘KPIs fit for purpose’ section of the LeaksSuite Library).
The Global ILIs section of the LeaksSuite website is pleased to provide a forum where the excellent leakage management performance of the Australian WSPs can be compared on a level playing field with other leaders in leakage management.
Countries or Regions which already have sufficient ILI data to justify a separate entry within Global ILIs are also invited to Contact Us at https://www.leakssuitelibrary.com/contact-us/