Assessing Random Uncertainty in Water Balance Calculations
Getting started – a practical approach
How reliable are volumes of Non-Revenue Water and its components, calculated from a Water Balance? The answer depends on many factors but it can be assessed. Practitioners who understand how to do this can quite quickly identify which water balance components should be targeted as priorities to reduce random uncertainties to an acceptable level, depending on local circumstances and whether the purpose is a preliminary assessment or a more detailed audit.
This paper attempts to de-mystify this topic by seeking to avoid, as far as possible, the use of specialist mathematical and statistical terminology; and explaining, step by step, how to set up basic spreadsheet calculations. It is hoped that practitioners without a deep knowledge of statistics can quickly gain important insights into assessing the uncertainties of water balance calculations, carrying out sensitivity testing, and quickly identifying priorities to improve the reliability of calculated NRW, Apparent and Real Losses volumes.
In the IWA Water Balance shown in Figure 1 below, a clear distinction is made between System Input Volume (which may include Water Exported to another distribution system) and Water Supplied (which excludes Water Exported). Each component of volume entered in a water balance may have a systematic error (either always positive, or always negative). Systematic errors in bulk metering, which are particularly influential in generating substantial errors in assessment of NRW and its components, are discussed in more detail in Appendix 1 of the MCAST Guidance Notes on Apparent Losses https://www.mcast.edu.mt/guidance-notes-app-loss/ . In the Water Balance in Figure 1, the volumes of bulk meters should be corrected for known systematic bulk metering errors.
Figure 1: IWA Water Balance with systematic bulk metering errors
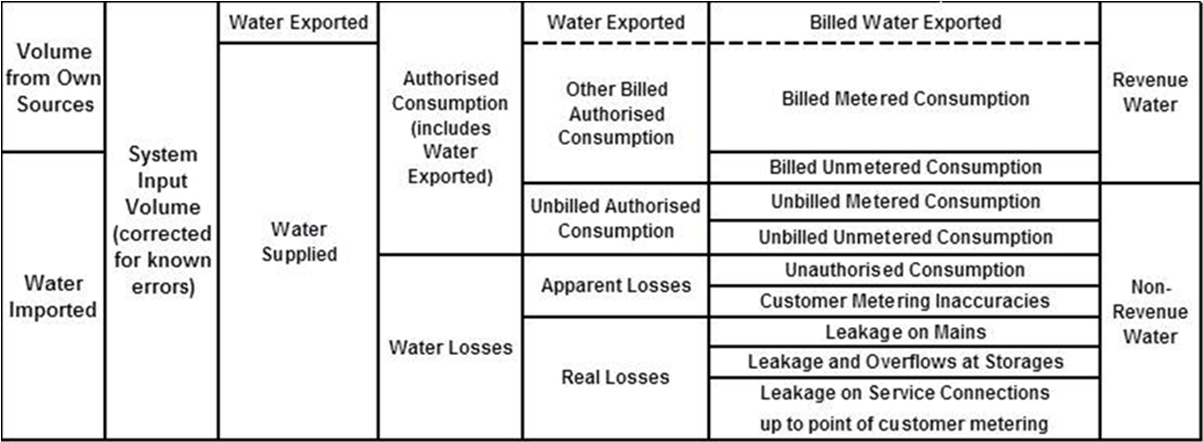
Even after known systematic errors in bulk meters have been corrected, these and other components of the Water Balance will also have random errors (equally likely to be positive or negative). This paper outlines a practical approach to assessing the combined influence of these random errors on the uncertainty of the calculated volumes of NRW, Apparent Losses and Real Losses. The mathematics and terminology of the so-called Normal (bell-shaped) probability distribution of errors, which is often used for these calculations, can be intimidating to practitioners who have not studied statistics, so they are frequently reluctant to attempt such calculations. Henry Ford said ‘Whether you think you can, or think you can’t, you are probably right’. This paper is written to encourage those who think they can (or are at least prepared to try)!
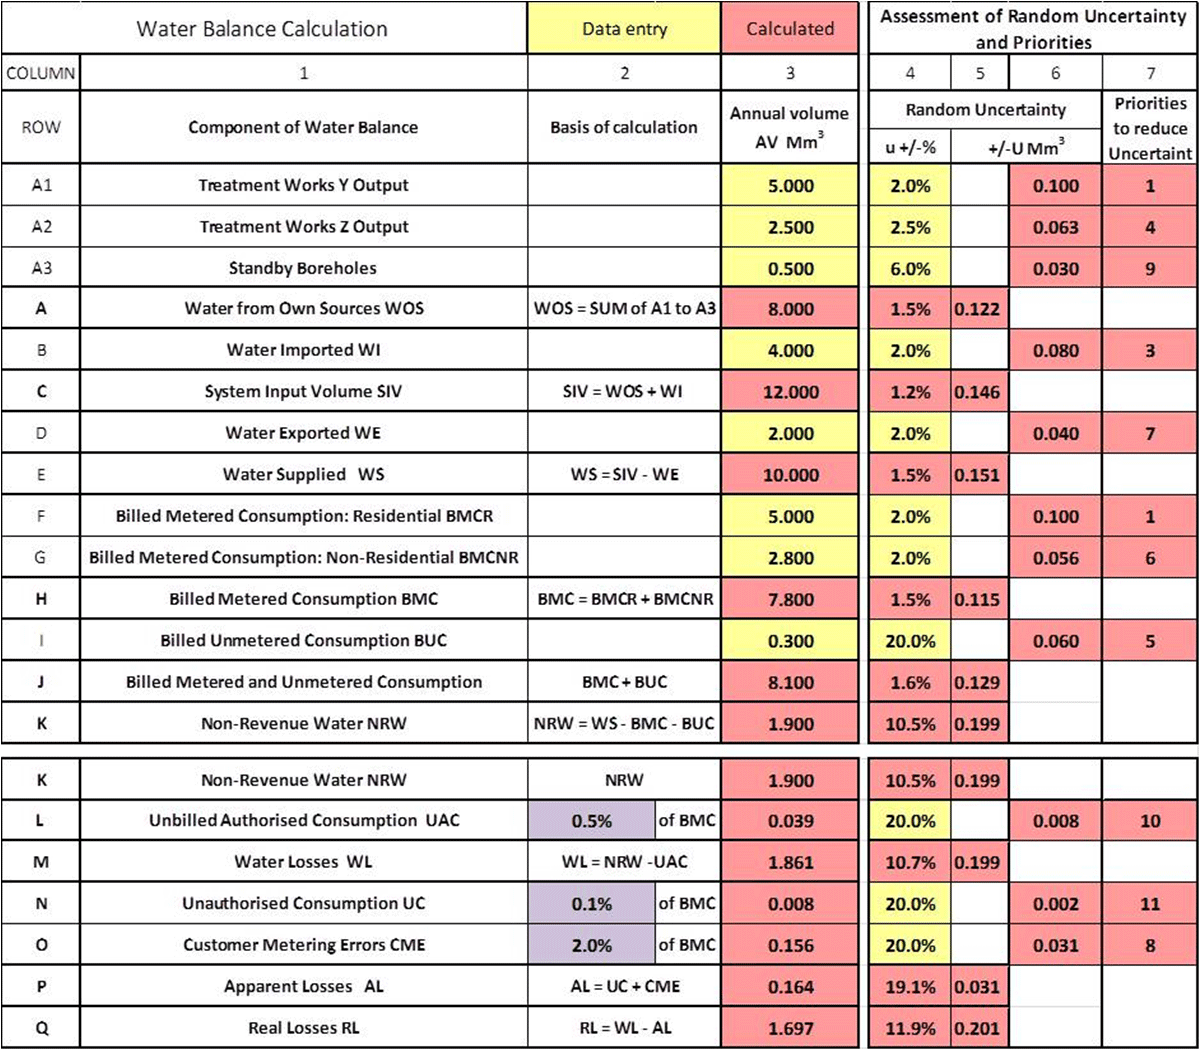
Table 1 shows an example IWA Water Balance calculation of Figure 1 in tabular form. Volumes in Million cubic metres (Mm³) have been entered in the yellow cells in Column 3 on Rows A, B, D, F, G and I. Volumes in pink cells in column 3 have been calculated. To see how this Water Balance was calculated, see https://www.leakssuitelibrary.com/iwa-water-balance
For the purpose of simplifying this demonstration of how to calculate uncertainty, a practical approach has been used to assess the mainly unmetered components of NRW in Row L (Unbilled Authorised Consumption), Row N (Unauthorised Consumption) and Row O (Customer Metering Errors). The %s in the blue cells in Column 2 are almost the same as the maximum guideline values expressed as % of Billed Metered Consumption (Row H), as recommended in Table 3 of the Good Practices on Leakage Management – Main Report_Final.pdf (2015), for a direct pressure system without roof tanks, in a high income European country. These maximum guideline values for initial calculations can of course be increased or decreased if appropriate for individual country or utility circumstances.
Table 1: Example Water Balance used for the purposes of this Guideline
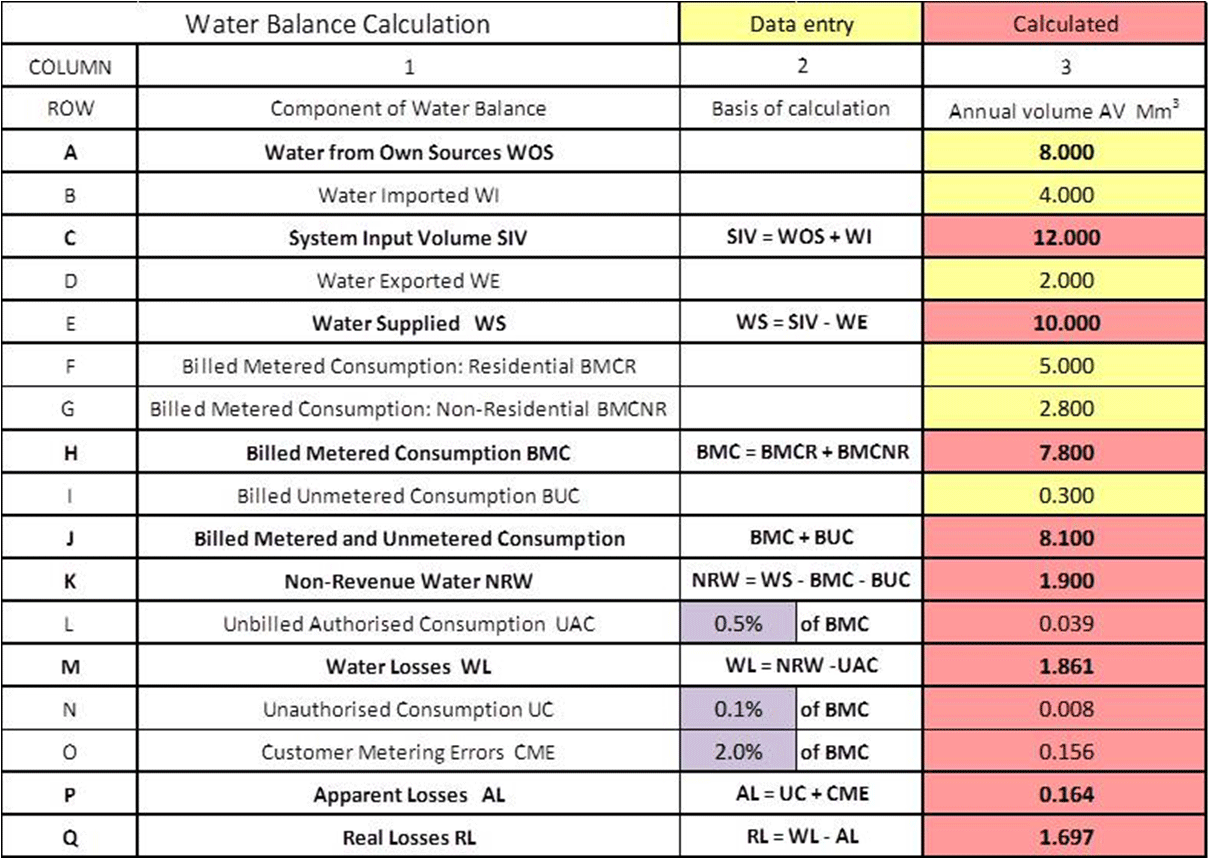
In this example, the water balance shows NRW as 1.900 Mm³, Water Losses as 1.861 Mm³, Apparent Losses as 0.164 Mm³ and Real Losses as 1.697 Mm³.
Part 1 of this paper shows how can we assess the uncertainty associated with each of these ‘data entry’ and ‘calculated’ figures using basic statistical principles.
Parts 2 to 4 explain the basic mechanism of calculations of uncertainty when adding or subtracting components of the water balance, with a few ‘Check your understanding’ questions. These take the calculations as far as Row E (Water Supplied).
Section 5 then shows the overview of calculations for the whole Water Balance, with the detail of the calculations from Rows E (Water Supplied) to Row Q (Real Losses) set out in detail in Appendix.
Note that although uncertainty in +/- % terms is used as part of the assessment calculation, it is preferable to ultimately quote uncertainty in volume terms which tends to be more stable than uncertainty in % terms.
Part 1: Introducing Uncertainty into Water Balance Calculations
Each of the measured or assessed volumes in a Water Balance has random uncertainties caused by broad combinations of different factors; some are large, others are small. In the case of a Water Balance, Uncertainty (U) represents uncertainty in volume terms (for example +/- 3 m3) and relative uncertainty (u) represents uncertainty in % terms (for example +/- 2%).
Because results of testing of bulk meters and customer meters are usually reported as percentages of recorded metered consumption, uncertainties of other water balance components, based on audits and personal judgement, also tend to be initially expressed as +/-%s of the volume component concerned. It is therefore usual to initially enter uncertainty figures as +/-%s, then to calculate uncertainty in +/-volume terms. Later in the calculation, ‘+/-u’ in % terms can be converted to ‘+/-U’ as volumes.
At this stage, the reader may think that major investigations will be needed to assess detailed values for +/-u% for all Water Balance components and may become discouraged. However, remember that the first few water balances for any system usually contain several ‘best estimates’ for volumes, which are gradually improved over time. Therefore, apply the same principle to your initial estimates of uncertainty; have faith in your judgement, get started and improve as you progress.
Put together whatever knowledge you currently have or could obtain fairly easily through asking direct questions and seeking opinions of water Utility personnel who provided the data. Inspect bulk meter installations, and check data transfer systems and data collection procedures. Then say to yourself ‘my initial assessment is that the +/-% uncertainty I should use for this component (say, a Water Imported bulk meter) is probably around +/- 2% of the likely true value’. You can always do sensitivity testing later, using improved estimates, after you have identified and prioritised investigations into what are likely to be the most influential components.
Part 2: Calculating Uncertainty for Water from Own Sources WOS
To show how to calculate uncertainty, start with the ‘Water from Own Sources WOS’, Row A in Figure 1. For the purposes of demonstrating the calculation process, in the example WOS is assumed to have three input components with different volumes and different +/-% random uncertainties. An assumed random uncertainty of +/-2% is close to the lowest practically achievable limit for a large bulk meter.
Treatment Works X output meter, with the largest output volume, has been checked annually by an in-situ flow reference standard method, and found to be within the minimum random uncertainty of +/-2% for the primary (meter installation) and secondary (electronics etc.) devices, for the method of testing used. Random uncertainties associated with data collection for Treatment Works X output are assumed to be zero as the Supply Operations Centre is located at Treatment Works X.
Treatment Works Y output meter, with the second largest volume output, is assigned slightly greater random uncertainty (+/- 2.5%) which includes an allowance for data collection errors . The volume pumped from standby borehole Z, with lowest volume output, is assessed from hand written records of pump running hours, and so the assumed random uncertainty is higher (+/-6%). Table 2 shows the calculation process, with arrows to indicate the steps of the calculations
Table 2: Assessing Random Uncertainty of Water from Own Sources WOS
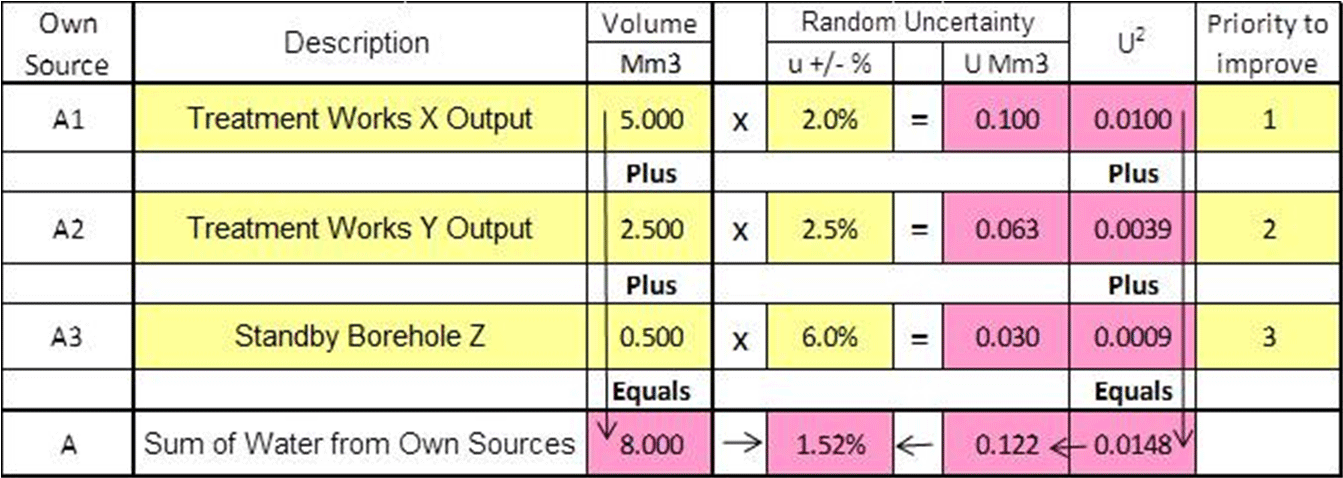
For each component enter the volumes in Mm³ for A1, A2, A3, and calculate the sum (8.000). Then, for each component on rows A1, A2, A3, multiply the Volume (Mm³) by the % uncertainty (u%) to get the Uncertainty U in Mm³ as a volume for each source.
Next calculate U² for each component A1 to A3, then add together all the U² values (= 0.0148). Then calculate the random uncertainty U in Mm³ on Row A for the whole of the Water from Own Sources by taking the square root of 0.0148 (= 0.122). The random uncertainty as a % is then 0.122/8.000 = +/-1.52%
It now becomes easy to identify priorities for reducing the uncertainty of the total Water from Own Sources (WOS) component of this Water Balance. Highest priorities have the highest Uncertainty Volume U (or the highest U², the resulting priorities are the same). Priority rankings 1, 2, 3 etc. are calculated automatically by software in the final water balance in Tables 5 and 6, to facilitate sensitivity testing for all volume components input to the water balance.
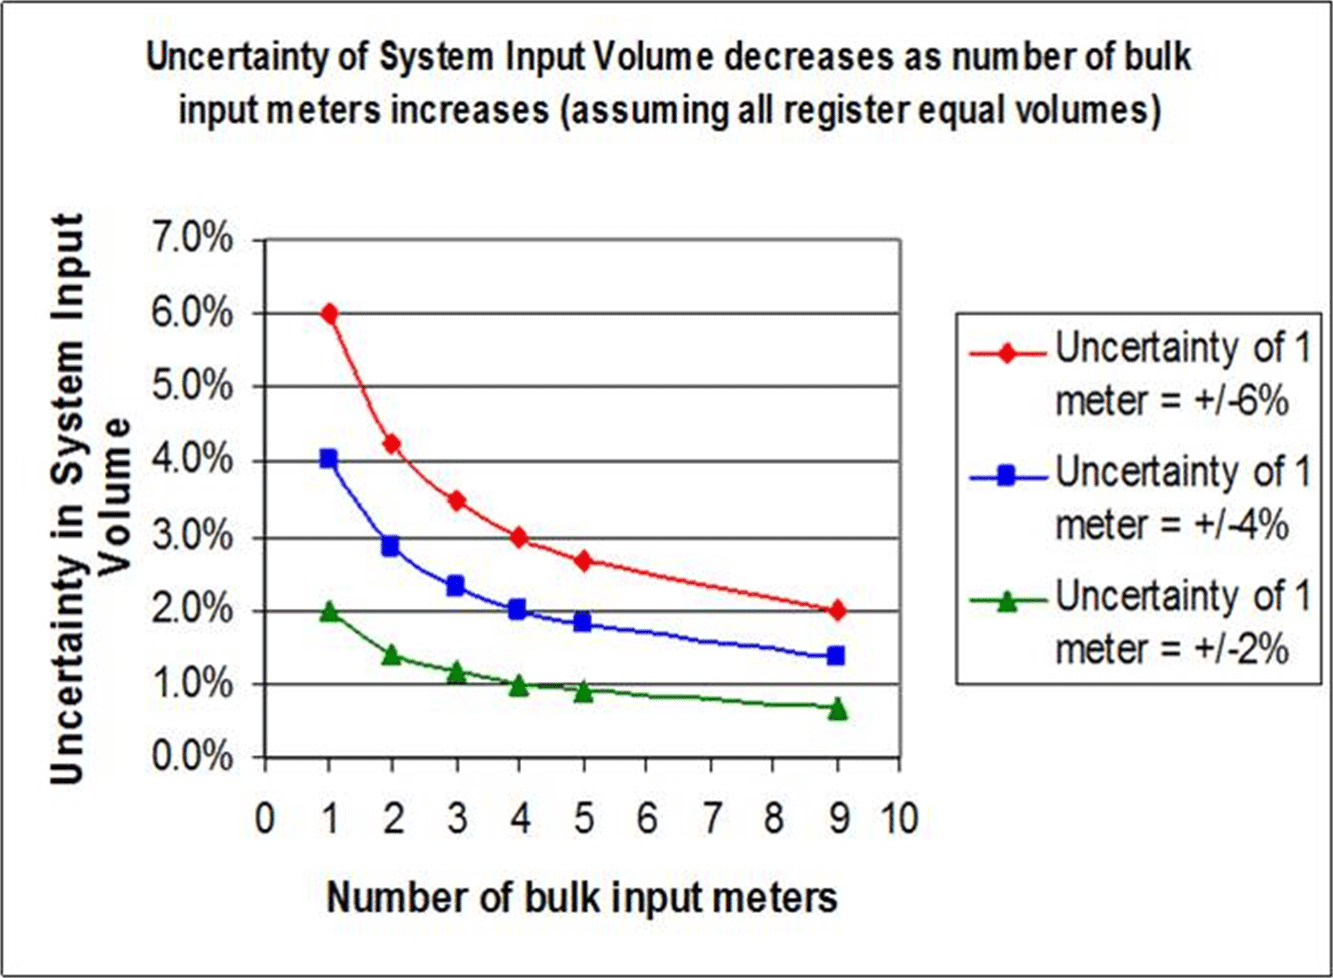
Note that the random % uncertainty (+/- u %) of 1.52% for the total WOS volume is less than any of the individual random % uncertainties (2.0% to 6.0%) for the components of WOS. In general, the more bulk metering inputs there are into a system (from WOS and Water Imported), the lower the weighted random uncertainty % will be.
Figure 2 shows how, in a system supplied by N bulk input meters with equal output and equal % uncertainty of u% ranging from +/- 6% each, to +/- 2% each, the overall weighted % random uncertainty for total Water from Own Systems can be calculated approximately as +/- u% divided by the square root of N.
Figure 2: Random Uncertainty % reduces with multiple sources
Part 3: Calculating Uncertainty for System Input Volume
You can now use this methodology shown in Part 2 to assess the uncertainty of System Input Volume, which equals Water from Own Sources (WOS) plus Water Imported (WI). As payment is usually required for Bulk Water Imported, a low uncertainty of +/- 2% for one bulk import meter will be assumed.
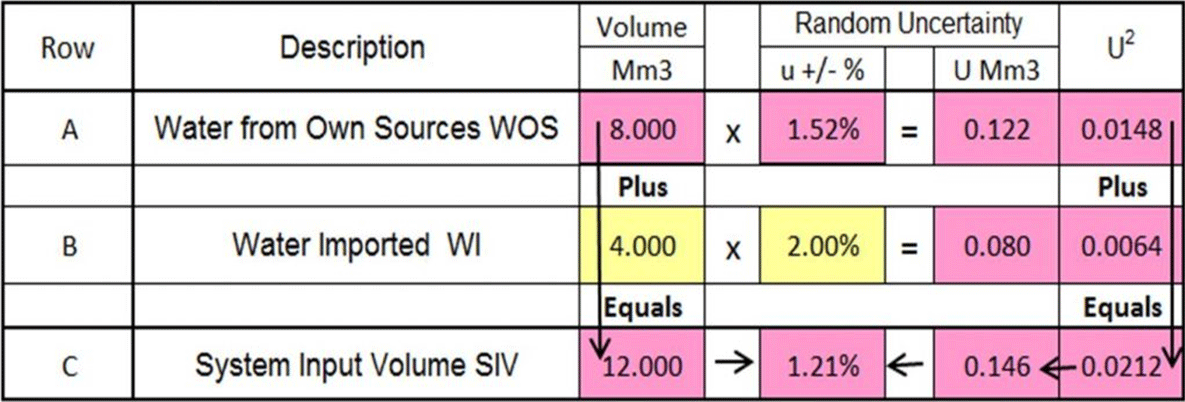
Table 3 shows the calculation of uncertainty for System Input Volume SIV, which is the sum of ‘Water from Own Sources WOS’ and ‘Water Imported WI’. As expected, an increase in the number of inputs reduces the % uncertainty, from +/- 1.52% for WOS, to 1.21% for SIV; even though the % uncertainty for Water Imported (+/- 2.0%) is greater than the % uncertainty for Water from Own Sources (+/- 1.52%).
Table 3: Assessing Random Uncertainty of System Input Volume SIV
Check your progress: If there were 2 bulk import meters, each with input of 2.00 Mm3 and +/- 2.0% uncertainty, how would the random uncertainty of +/- 2.00% change?
Answer: use Figure 2: if the uncertainty for 1 meter is +/- 2.0%, the uncertainty for the sum of 2 meters with equal throughput is +/- 2.0%/SQRT (2) = +/- 1.41%
Draft a spreadsheet: Reproduce Table 3 as a spreadsheet, and substitute uncertainty of +/- 1.41% for Water Imported. What does the uncertainty of System Input Volume change to?
Answer: from +/- 1.21% to +/- 1.12%
Part 4: Calculating Uncertainty for Water Supplied
The methodology shown in Parts 2 and 3 can be used to assess the uncertainty of Water Supplied, which equals System Input Volume minus bulk Water Exported. As payment is usually required for Bulk Water Exported, we will assume one bulk export meter with volume recorded with an uncertainty of +/- 2%.
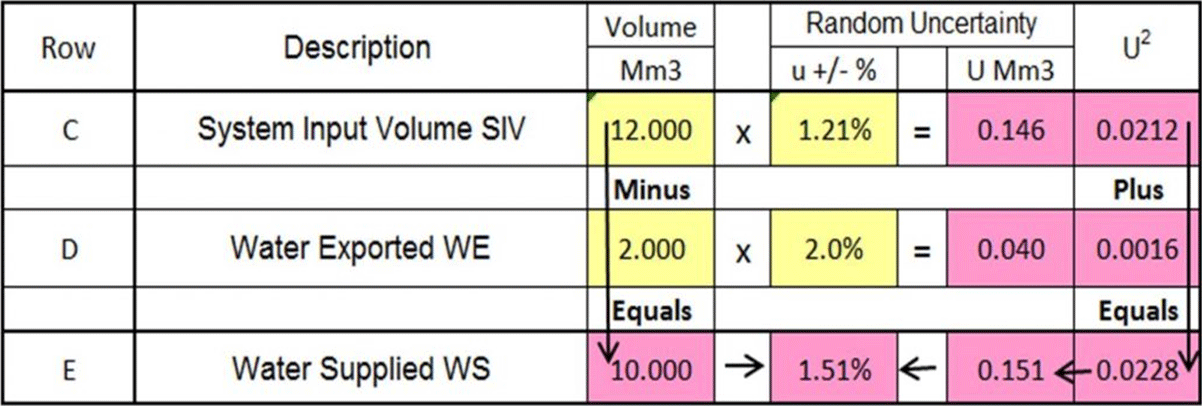
Note that in this calculation (Table 4), even though Water Supplied WS in Mm3 is calculated as one bulk metered volume (SIV) minus another (Water Exported), the values of U2 in the final column are always added to each other. In calculation steps such as this, in which some flow volumes are subtracted, the Water Supplied volume (Row E) is usually less than the System Input Volume (Row C). The effect of these changes is that the random % uncertainty in Water Supplied (+/-1.51%) is now greater than the random % uncertainty in System Input Volume (1.21%).
Table 4: Assessing Random Uncertainty of Water Supplied WS
Draft a spreadsheet: Reproduce Table 4 as a spreadsheet, and experiment by increasing the Water Exported in 1 Mm3 steps up to 11.0 Mm3. What happens to the Uncertainty of Water Supplied?
Answer: Uncertainty rises from +/- 0.151 to +/- 0.264 Mm3, and from +/- 1.51% to +/- 26.4%
Any system with a high proportion of Water Exported is likely to experience greater uncertainty in Water Supplied and subsequent water balance calculations than a similar system which does not export water. Transmission mains systems, where water exported is often a very high proportion of System Input volume, can experience extremely high uncertainty for real losses calculations.
Perhaps surprisingly, this problem is not generally appreciated unless random uncertainty is routinely calculated for distribution systems with substantial exports. Also, in Utilities with relatively low leakage (Infrastructure Leakage Index less than 1.5), several examples have been found, in supply Zones linked by a transmission main, where an unusually low ILI in one Zone coupled with an unusually high ILI in the adjacent Zone have identified a systematic error in the bulk metering of exports and imports between the two supply Zones.
Part 5: Water Balance with Uncertainty Analysis, showing calculations and Priorities
The step-by-step calculation methods described in Parts 2 to 4 contain the building blocks which have been used to progress from Row E (Water Supplied) onwards in the Water Balance spreadsheet in Table 5 below. The same step-by-step approach has been used to complete the calculations. Readers wishing to follow and reproduce (in their own spreadsheets) can find the detailed calculations from Rows F (Billed Metered Consumption) to Q (Real Losses) in the Appendix to this paper.
This method of assessing uncertainty in Water Balances has been used for more than 20 years by the Author and some colleagues in the IWA Water Loss Specialist Group. It is often an unwelcome surprise for Utilities to realise that, in Water Balance calculations, the calculated volume of Non-Revenue Water and Real Losses can have significant random uncertainties even after known systematic uncertainties have been identified and allowed for.
However, because the calculation method automatically identifies priorities to reduce the uncertainty, available resources can be quickly targeted to the most appropriate activities.
Table 5: Water Balance with Uncertainty Analysis, showing calculations and Priorities
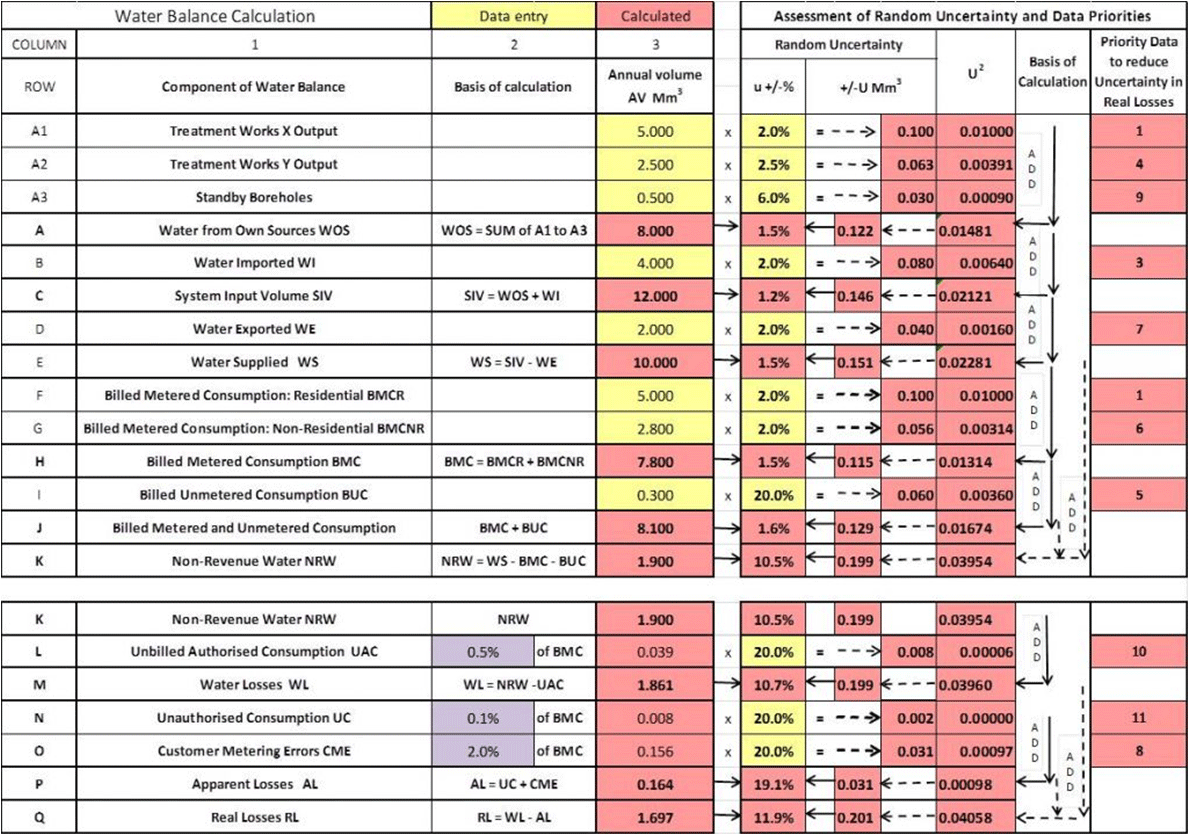
A more user-friendly presentation of the Table 5 calculations is shown in Table 6.
Readers may have assumed that components with the largest +/- % uncertainty would be the priorities for investigation, but Table 6 shows that it is the multiple of volume x % uncertainty which defines priorities for reduction of random uncertainty in calculated NRW and Real Losses.
Table 6: User-Friendly Water Balance with Uncertainty Analysis, with U² calculations hidden
The author encourages readers of this paper to create their own spreadsheet to reproduce the calculations in Tables 5 and 6, and then to do ‘what-if’ sensitivity testing by increasing or decreasing the assumed uncertainty in the yellow cells to see the effect on overall uncertainty. Priorities in Column 7 to reduce uncertainty are calculated by ranking the U Mm³ values in Column 6.
It is usually the case that bulk metering and billed metered consumption will contribute most strongly to the uncertainty for direct pressure systems. However, for systems where customers have individual storage tanks, uncertainty for under-registration of metered consumption can be a major component of uncertainty
Quoting volume and uncertainty of NRW and its components to four significant figures implies an unjustified degree of precision. The uncertainty assessment should be considered a part of the audit process which can be summarised as follows: ‘Uncertainty calculations using reasonably realistic assumptions have been used, with sensitivity testing, to identify and prioritise checking of water balance components which contribute most to uncertainty. Resulting uncertainty of individual components has been reduced to ‘fit for purpose’ achievable values which are consistent with assessed Real Losses of 1.70 Mm3 with assessed uncertainty of +/- 0.20 Mm3.’
Summary and Further Initiatives on Uncertainty in Calculating Real Losses
- The author and some international colleagues have been using these techniques, with more or less statistical detail, for over 20 years, to give practical insights into the reliability of Water Balance calculations, and to identify how to prioritise components of a water balance for further investigation, and to reduce the uncertainty of the calculations.
- The author believes that many practitioners could benefit from being able to undertake basic uncertainty analysis of water balance calculations, but are deterred from doing so due to lack of understanding of what appear to be complex statistical methods.
- This paper presents a basic step-by-step methodology to encourage others to overcome this problem and create their own spreadsheet calculations, in the interests of improving the reliability of international calculations of NRW and real losses.
- By showing that uncertainty calculations for water balances are basically just a repetitive step-by-step process with simple rules, rather than an intimidating calculation which only a statistician could understand, it is hoped this paper will encourage more leakage practitioners to begin to incorporate uncertainty assessments into their Water Balances.
- The methodology described here only applies when all the parameters (in this case, volumes) are in the same units. A further Paper – Random Uncertainty in Leakage KPIs – is being updated and will be added to the Concepts Section of the LEAKSSuite Library in 2020. This will show step-by-step practical methods for calculations of random uncertainty in performance indicators for the above Water Balance calculation.
Appendix: Assessing Random Uncertainty for Components Water Supplied in the Water Balance
A1 Uncertainty for Billed Metered and Unmetered Consumption (excluding Water Exported)
The calculation in Table A1 shows the assessment of uncertainty for Billed Metered and Unmetered Consumption. As Residential and Non-Residential meters may be read at different frequencies, and Non-Residential Meters may have different under-registration characteristics when assessing Apparent Losses, most Water Balances separate Billed Metered Residential and Billed Metered Non-Residential consumption.
Table A1 initially adds Billed Residential and Billed Non-Residential metered consumption (Rows F and G), to obtain the uncertainty of Billed Metered Consumption BMC on Row H. It is assumed that the % uncertainty of metered volumes entered in Rows F and G are +/-2%; this allows for a robust customer meter data collection system with meter readings at least twice a year, substitution of missing data, and correction for influences of meter lag, where the metered volumes are adjusted to be equivalent to the period between the start and finish dates of the Water Balance. In some cases, where there are 5 or more separate categories of Billed Metered Consumption, it is hoped that the reader may now be confident enough to attempt to create an appropriately detailed uncertainty assessment calculation in their own spreadsheets, and to split Customer Metering Errors into the same number of components.
The uncertainty of assessed Billed Unmetered Consumption volume on Row I is assumed to be +/-20% for the initial uncertainty calculation. This can be adjusted later for sensitivity testing. Billed Unmetered Consumption (Row I) is then added to Billed Metered Consumption (Row H) to get the total Billed Metered and Unmetered Consumption volume, and its uncertainty, on Row J.
Table A1: Assessing Uncertainty for Billed Metered and Unmetered Consumption (excluding Water Exported)
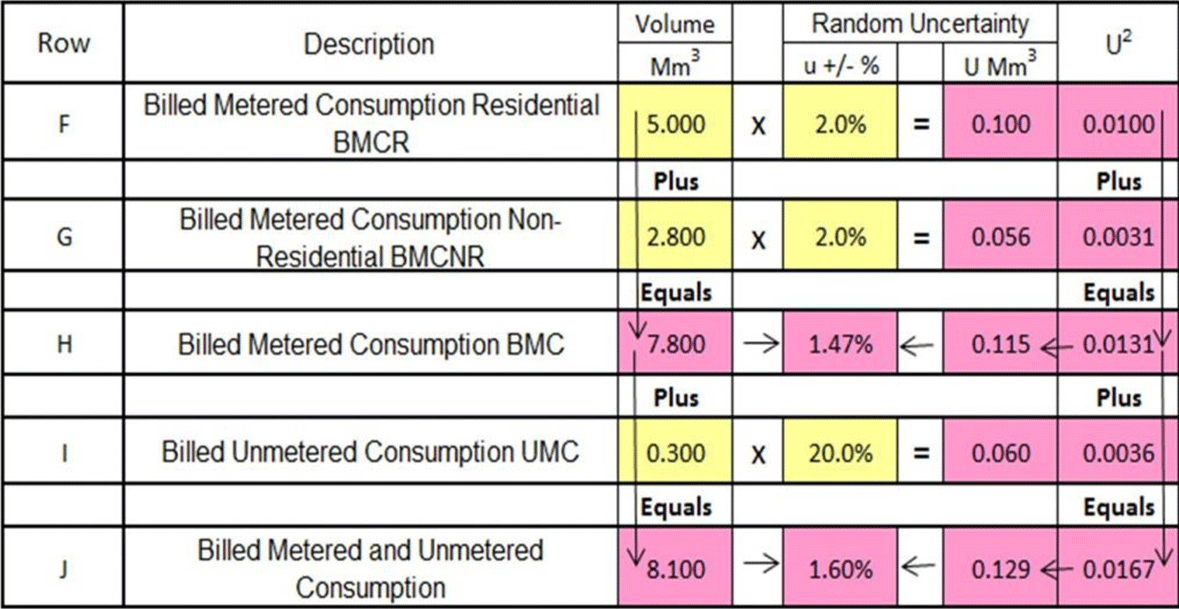
In this example, the addition of Billed Unmetered Consumption with a much higher % uncertainty than Rows F, G and H causes the uncertainty for Row J to rise, compared to Row H.
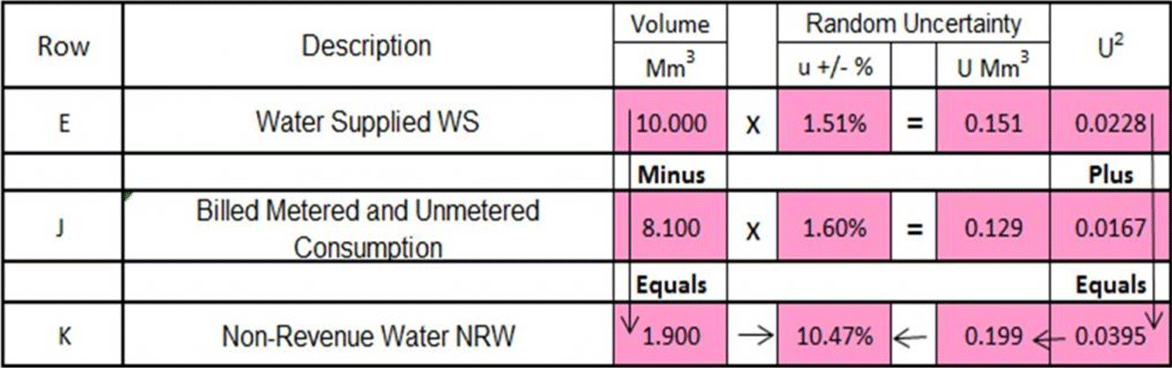
A2 Uncertainty calculation for Non-Revenue Water
Non-Revenue Water is Water Supplied (Row E from Table 4) minus Billed Metered and Unmetered Consumption (Row J, calculated in Table A1 above). The calculations are shown in Table A2. Because the random errors are allocated a much smaller volume, uncertainty has jumped from +/-1.51% for Water Supplied to +/- 10.47% for NRW.
Table A2: Assessing Uncertainty for Non-Revenue Water
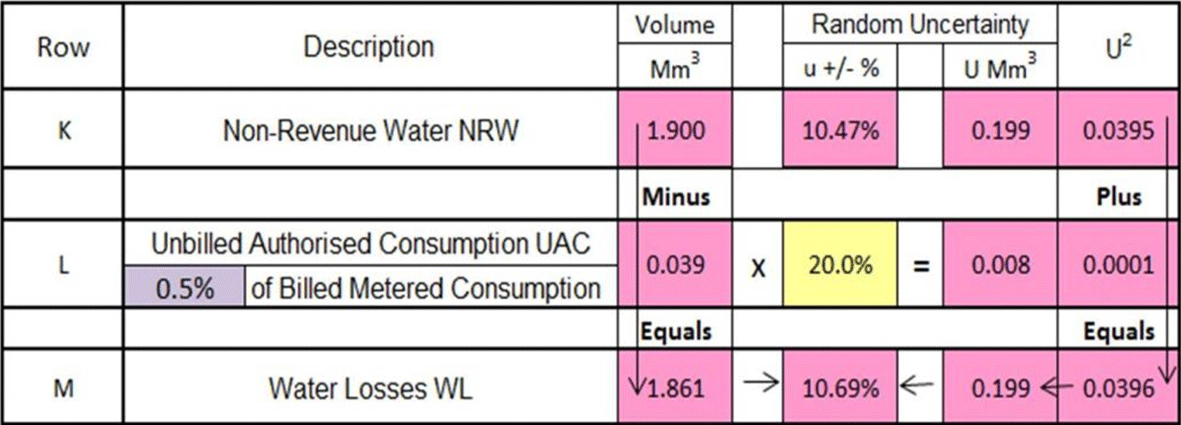
A3 Uncertainty calculation for Water Losses
Water Losses WL (equal to Apparent Losses + Real Losses) are calculated by deducting Unbilled Authorised Consumption UAC from Non-Revenue Water. The maximum guideline value for UAC recommended in Table 3 of the Good Practices on Leakage Management – Main Report_Final.pdf (2015), for a direct pressure system without roof tanks, is 0.5% of Billed Metered Consumption. As this is usually mostly an unmetered component the uncertainty u is assessed as +/- 20%: that is to say that the % is in the range +/- 0.4% to +/- 0.6%.
Table A3: Assessing Uncertainty for Water Losses
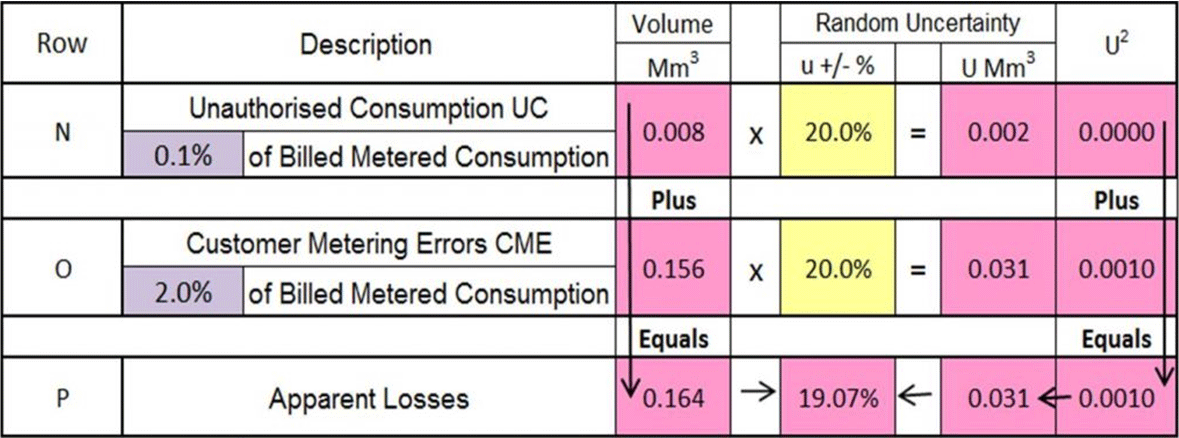
A4 Uncertainty calculation for Apparent Losses
Apparent Losses (AL) are the sum of Unauthorised Consumption (UC) and Customer Metering Errors (CME). The maximum guideline values for UC and CME recommended in Table 3 of the Good Practices on Leakage Management – Main Report_Final.pdf (2015), for a direct pressure system without roof tanks, as %s of Billed Metered Consumption, are respectively 0.2% (0.1% is used here) and 2.0%. As Unauthorised Consumption is an unmetered component the uncertainty u is assessed as +/- 20%. Uncertainty of Customer Metering errors can be assessed from meter testing programs, but in the absence of such programs for this system, uncertainty is assessed as +/- 20%. That is to say, +/- 20% of the default of +/- 2.0% of Billed Metered Consumption, so the Customer Metering Error is between +/- 1.6% and +/- 2.4%. The uncertainty in Apparent Losses volume is +/- 19.07%
Table A4: Assessing Uncertainty for Apparent Losses
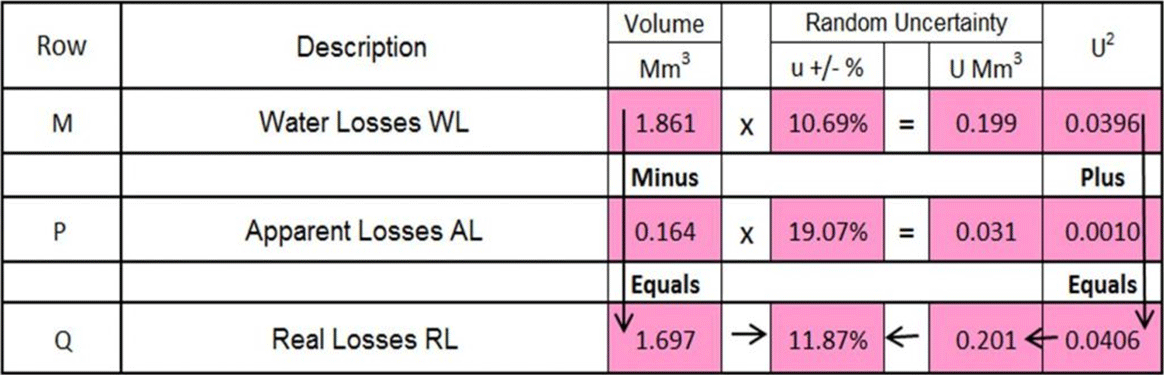
A5 Uncertainty calculation for Real Losses
Real Losses (RL) are calculated as Water Losses (WL, calculated in Table A3) minus Apparent Losses (AL, calculated in Table A4). The calculations are shown in Table A5. The uncertainty in Real Losses volume is +/- 11.87%.
Table A5: Assessing Uncertainty for Real Losses