ILIs in Denmark 2014
In 2013, when DANVA reported water losses in terms of % of System Input Volume and m3/km of mains/day, they noted that although water loss volume was reducing, water loss in % terms had not improved significantly due to the continued decline in water usage. To understand why this paradox occurs, see KPIs Strengths and Weaknesses in the KPIs Section of this website. Following publication of ILIs from 71 European Countries in 2014, DANVA included ILIs from 37 Danish Utilities in their next benchmarking publication Water in Figures 2015 and agreed that the ILI data could be made available for publication in the Global ILIs section of the LEAKSSuite website (now LEAKSSuite Library).
This ILI data contains many low ILIs, confirming Denmark’s standing as one of the world leaders in water loss management.
A customised version of the European Water balance and PI free software EurWB&PICalcs was used with the individual system characteristics and average pressures to check the water balance and assumptions, and calculate the KPIs as summarised below. Unlike most other countries, Danish Utilities make zero (or very little) deduction for customer meter under-registration when calculating Real Losses, so NRW and Water Losses are almost wholly Real Losses.
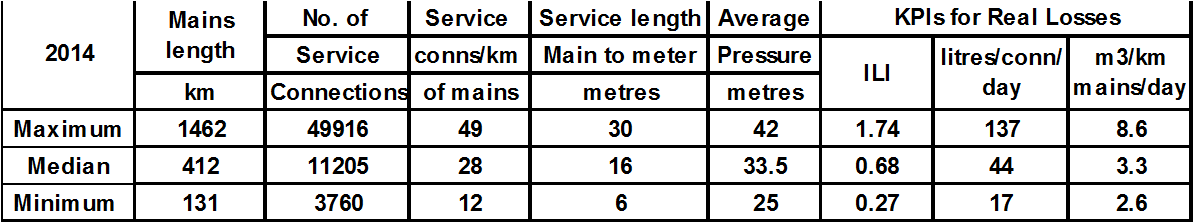
As all the system characteristics and KPIs for the largest Utility in the data set are not available, they are not included in the above Table. However, all 37 ILIs from the published DANVA data set are shown in the bar chart below
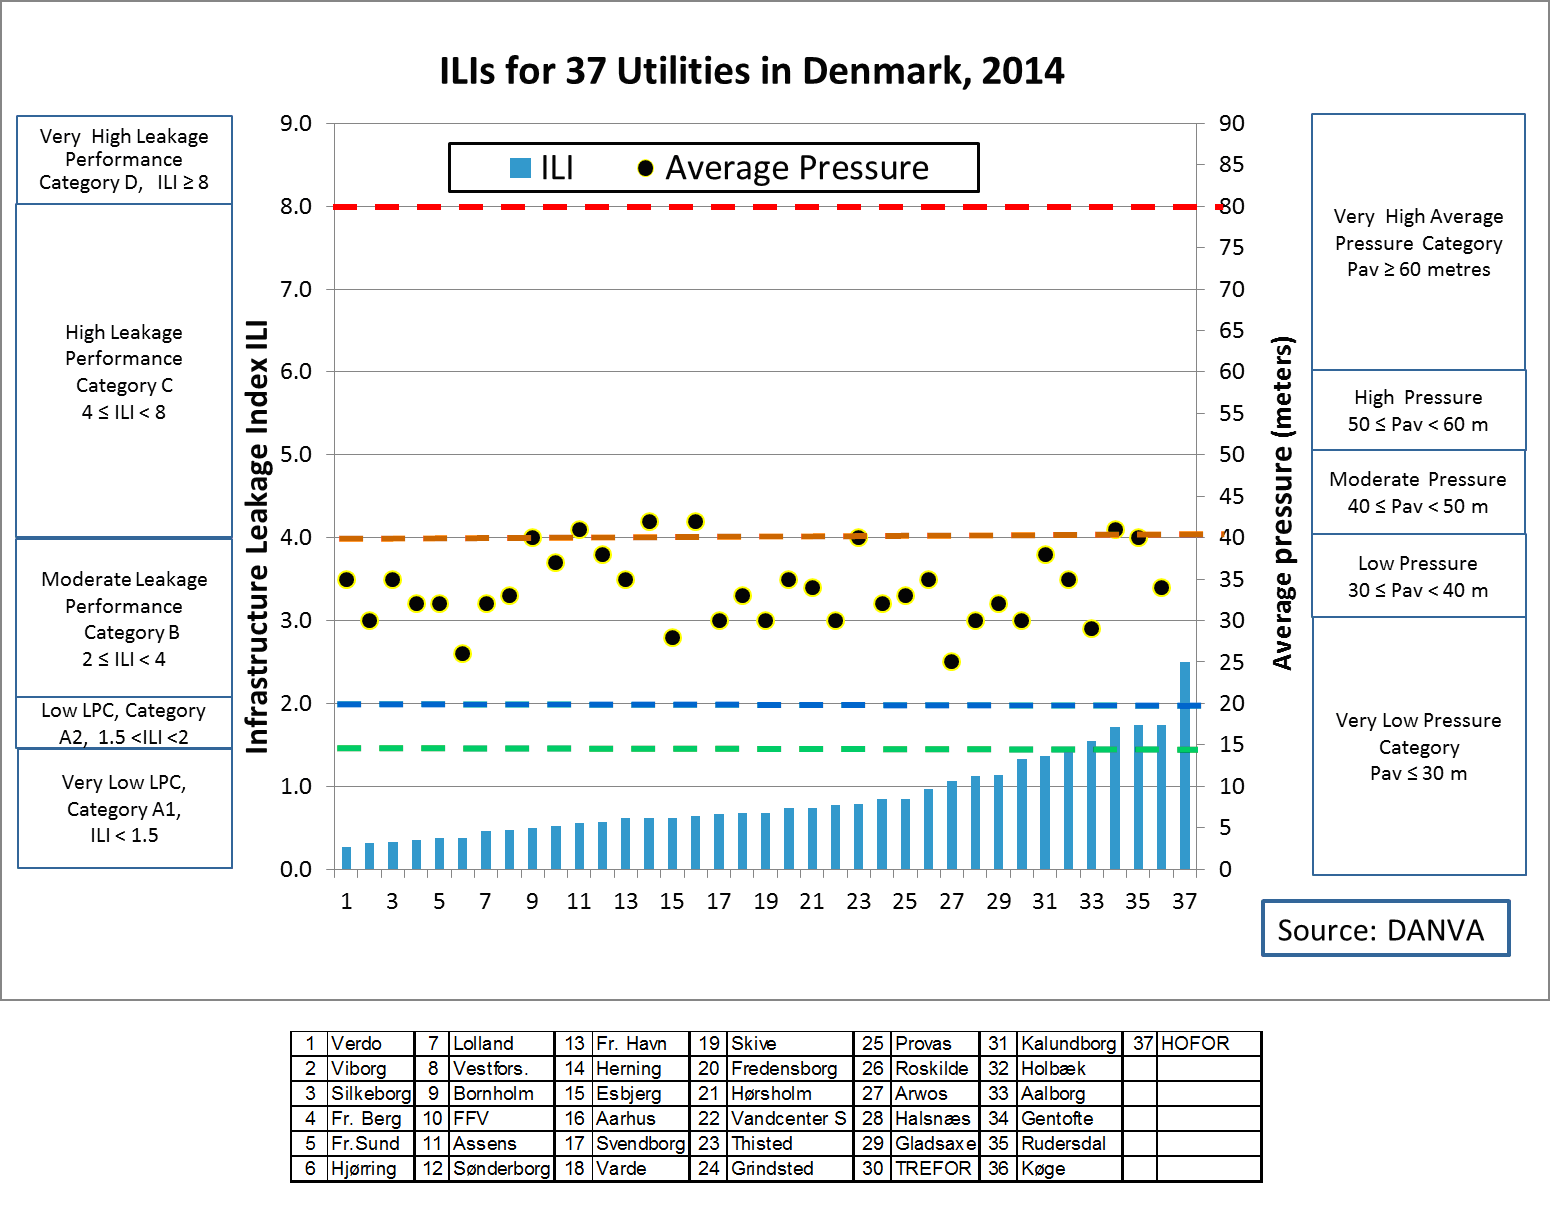
Leakage Performance categories next to the left side axis, and System Pressure categories next to the right side axis, are as recommended in the EU Good Practices on Leakage Management (2015). See the Table at the end of UARL&ILI for further details on Categories.
The 2015 EU Good Practices reference document clearly identifies reduction of excess pressures as the foundation for successful implementation of other complementary leakage control strategies. Pressure management and district metered areas have been actively promoted in Danish Utilities’ strategy. Almost all of the 36 Danish systems have average pressure in the Low (< 40 metres) category, with several in the Very Low (<30 metres) category.
One Utility has an ILI within Category B1 (2 <ILI <3). 36 Utilities have ILIs within Category A (ILI < 2); 33 are within Category A1 (ILI < 1.5). and 26 have ILIs less than 1.0, meaning they are achieving lower real losses than calculated using the standard international equation for Unavoidable (Technical Minimum) Annual Real Losses. It is recognised that ILIs less than 1 can occur in some situations, and reasons for this are discussed and explained in Low ILIs and Small Systems
At Low and Very Low average pressures, with flexible pipe materials, the calculated Unavoidable Background Leakage component of the UARL equation needs to be reduced by more than the usual simple assumption of a linear pressure:leakage relationship. Burst frequency is also reduced at lower pressures, and repair frequencies in this group of Danish Utilities average only 36% of mains repair frequencies and 50% of service repair frequencies assumed in the standard UARL formula at 50 metres pressure.
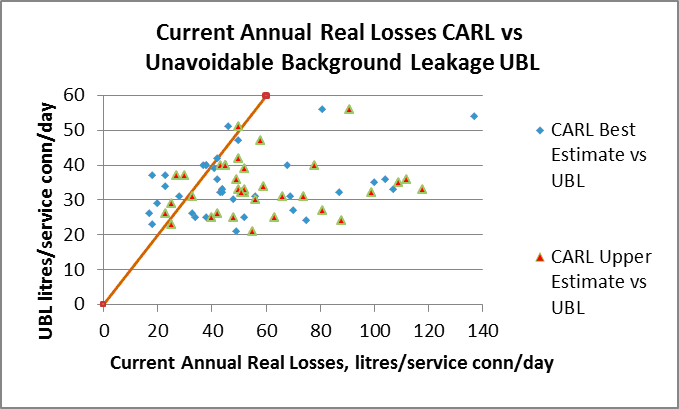
So it might be expected that the Danish Utilities with lowest leakage would slightly exceed the calculated Unavoidable Background Leakage, after allowing for confidence limits arising from small errors in Water Balance components accumulating in calculated Real Losses. In the graph below, the best estimates of real losses (blue data points) and 95%ile upper estimates (red data points) are compared with Unavoidable Background Leakage (UBL), in litres/service connection/day. Only four out of 36 values of the red data points fell slightly below the calculated UBL line, indicating that the UBL formula appears to be quite robust at pressures between 25 and 40 metres; more detailed component analysis is recommended.
The low ILIs and good quality of the Danish data could provide a useful resource for refining predictions of low leakage achievable using pressure management as the foundation for implementing other good leakage management practices; remember, every meter counts.
The comments on this ILI data by WLRandA Ltd do not purport to represent the opinions or policies of any individuals, Companies and Utilities which assisted in provision of the data.
Countries or Regions which already have sufficient ILI data to justify a separate entry within Global ILIs are also invited to Contact Us at https://www.leakssuitelibrary.com/contact-us/