ILIs in Canada 2003 to 2014
The IWA Best Practice Water Balance (2000) was adopted in the Canadian InfraGuide in the same year (2003) as the American Water Works Association (AWWA) adopted the IWA Water Balance and Performance Indicators. Although the InfraGuide did not specifically adopt the IWA Best Practice PIs in 2003, some progressive Utilities (notably Halifax Regional Water Commission) and Consultants (notably Veritec Inc) began to calculate real losses in terms of ILI and litres/connection/day. The North American data set of 25 ILIs for 2011, assembled and validated by the AWWA Water Loss Control Committee through its Water Audit Data Initiative (WADI), contains ILIs for two Canadian Utilities.
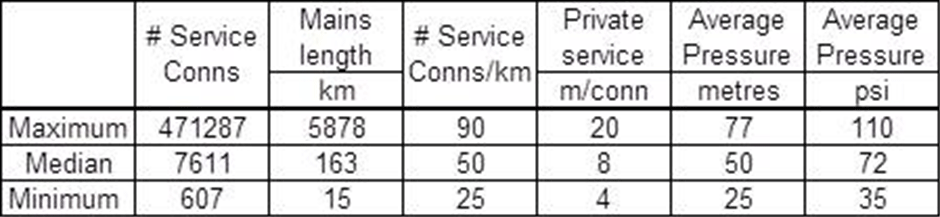
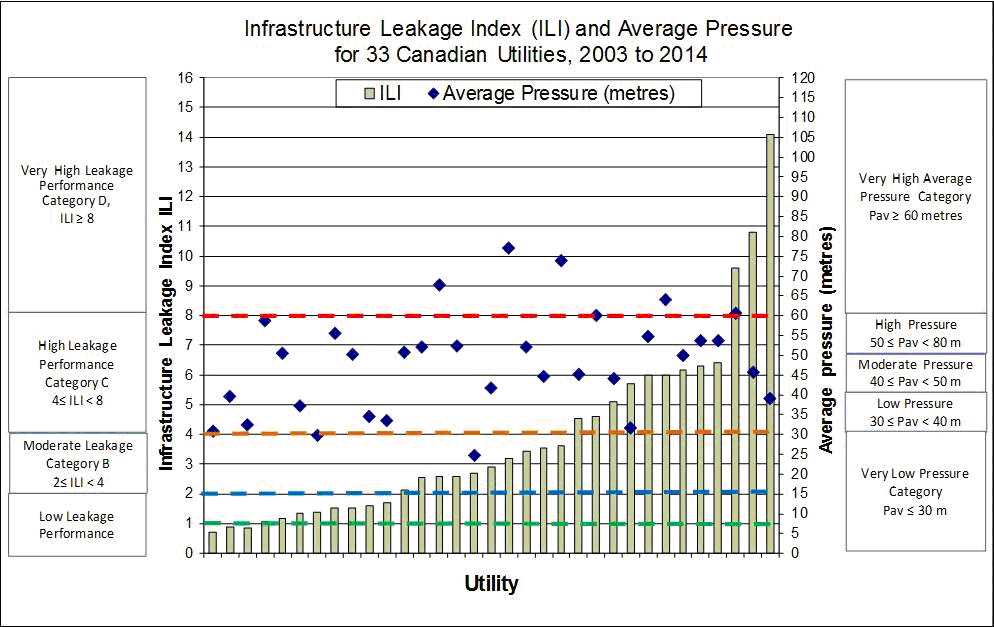
Since 2003, ILIs have been calculated from annual water balance data for a significant number of Canadian Utilities by trusted sources experienced in the IWA methodology, and are presented here on an anonymous basis. Ranges of system size, other infrastructure and pressure parameters, and calculated ILIs, are shown in the Table and Bar Chart below. ILIs for two transmission systems (not included in the data below) operating at 85 and 133 metres average pressure; were 0.9 and 1.3.
In larger Utilities, there can be large variations between ILI in different sectors. The graph below from Halifax Water shows that overall ILI has been reduced from 6.1 in 2001 to 2.4 in 2014, but there are wide variations within the system
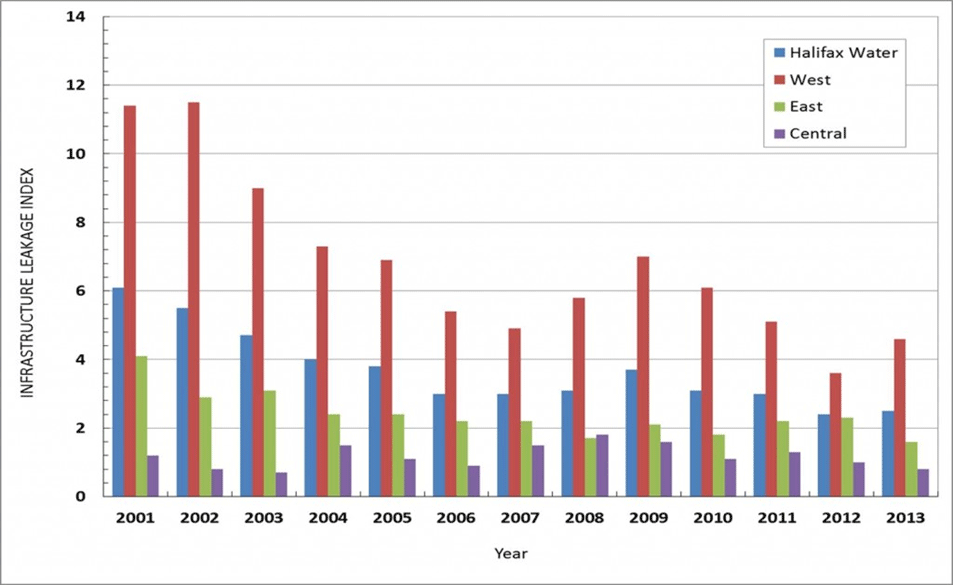
In the older infrastructure in Halifax West Area (overlying fractured rock) it is an ongoing challenge to hold ILI at less than 4.0. In contrast, the newer Central Area now maintains an ILI close to 1.0, and East Area an ILI close to 2.0 (both with some fluctuations from year to year). Latest initiatives concentrate on identifying and eliminating operational reasons for individual bursts, and improved management of apparent losses.
Recent studies in Austria using component analysis and pressure:leak flow relationships have shown how it is possible for very small stand-alone systems (less than around 3000 service connections) to achieve ILIs less than 1.0. Six of the 33 systems in the current Canadian ILI data set have less than 3000 service connections, and 4 of these have very low ILIs in the range 0.9 to 1.4. There are many very small Utility systems in Canada, and calculation of ILIs has been required in 2015 for some of these within the Water Smart Initiative of the Colombia Basin Trust using a mix of ILIs based on annual water balance and Snapshot ILIs based on minimum night flows. The Austrian ‘small systems’ experiences may be relevant to setting achievable targets in such systems.
Acknowledgements and thanks: to Ken Brothers (Hydrotech Consulting); Alain Lalonde and Graham Waley (formerly of Veritec Consulting Inc,); Carl Yates, Reid Cambell and John Eisnor (Halifax Water); Jamie Eichenberger (Iken Services), Mathieu Laneuville and Ushanthan Murugananthan (Quebec Ministry of Municipal Affairs).
The comments on this ILI data do not purport to represent the opinions or policies of any individuals, Companies and Utilities which assisted in provision of the data.
Future Updates: Countries or Regions which already have sufficient good quality ILI data to justify a separate Webpage within Global ILIs are invited to contact https://www.leakssuitelibrary.com/contact-us/