ILIs in Austria – update 2015
Following several years research and trials into the application of the ILI within Austria, OVGW re-issued their W63 Guideline in 2009 with ILI as the decisive real losses performance indicator. During the OVGW trials, some ILIs less than 1.0 were reported, and although some of these were later identified as having systematic water balance errors (for example unmetered public fountains), it became clear that ILIs less than 1 were occurring in numerous small Austrian systems.
Austria has around 5500 Water Utilities, with around 5000 of them having less than 3000 service connections, which is the generally recommended lower guideline limit at which the standard UARL equation used in ILI calculations may need customising with a Correction Factor. Such systems would be classified as ‘Very Small’ in EU Good Practices on Leakage Management (2015).
Studies in 2007 and 2011 of good quality Austrian data using component analysis and pressure:leak flow rate and pressure:bursts prediction methods have identified some reasons why ‘Very Small’ Utilities can achieve annual leakage lower than the UARL formula (ILI less than 1.0).
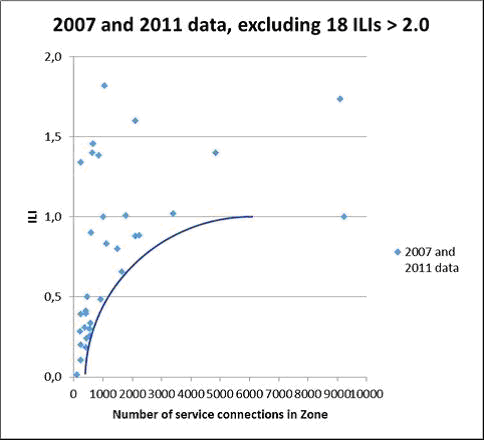
Selected small system ILIs (original data source: OVGW benchmarking)
Source: Austrian Small Systems Case Study in Good Practices on Leakage Management – Case Study document._Final.pdf
Having identified at least some of the factors which can result in ILIs less than 1 in well managed ‘Very Small’ systems, the next step was to gather and review an ILI data set for ‘Small’ and ‘Medium’ sized systems with 3000 to 300,000 service connections. OVGW kindly provided anonymous ILI data with average pressures from their 2011 survey, as shown in the Table below.
Because of the varied topography and generally high quality of design and construction standards for infrastructure in Austria, pressure management is not as widely practiced for management of Real Losses as in other European countries.The average pressures in this data set are all in the range 45 to 60 metres.
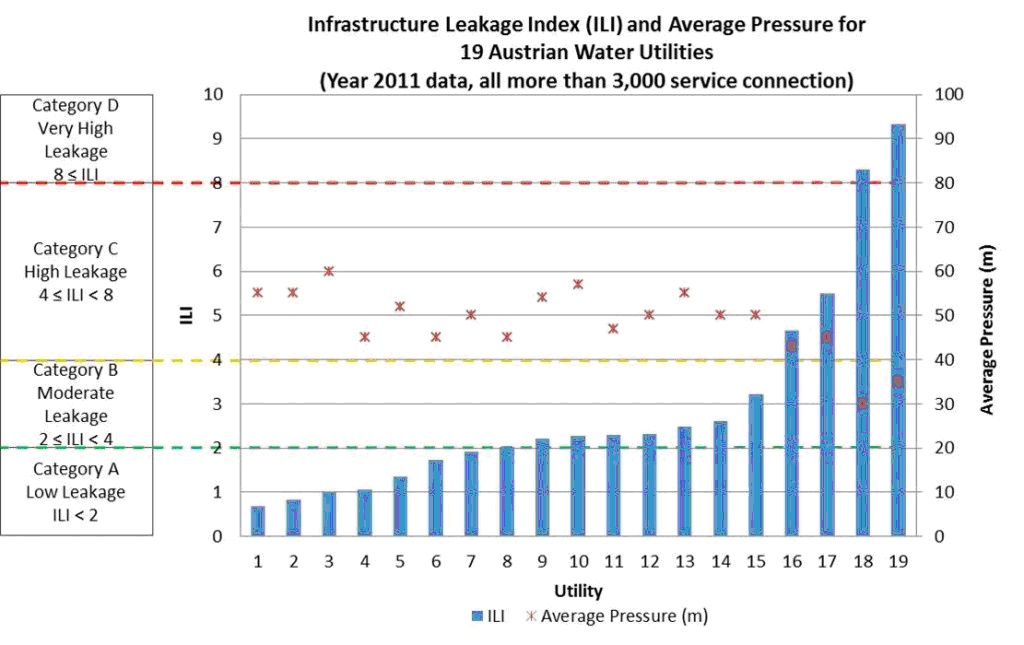
The ILI ranges in Categories A to D in the above bar chart are those used in EU Good Practices on Leakage Management (2015) and the OVGW W63 descriptions for these Classes are shown in the Table below.
Descriptions of Austrian OVGW categories Performance Bands A to D
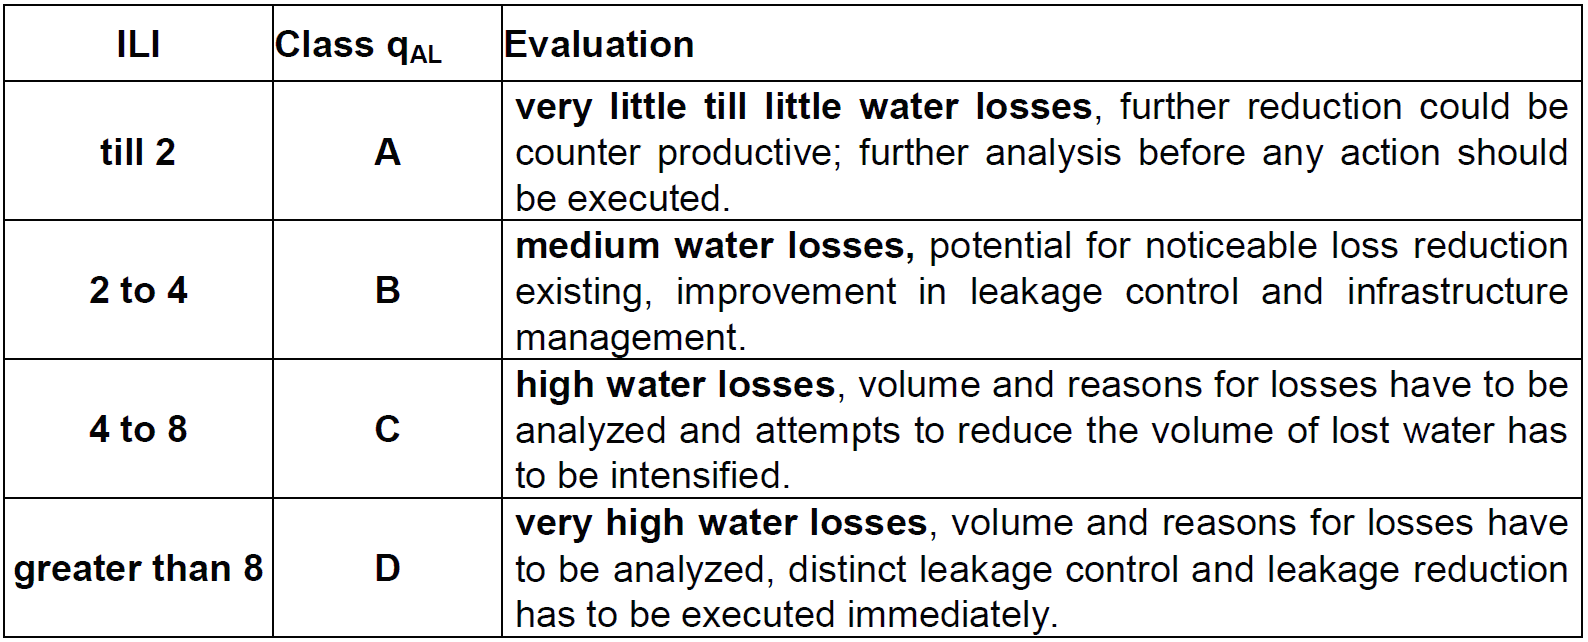
Source: OVGW W63 (English Language version):
Acknowledgements and thanks: to OVGW (Mr. Manfred Eisenhut) for approving the publication of this data; to Daniela Fuchs-Hanusch for preparing the data, and to Joerg Koelbl for ongoing guidance in understanding and interpretation of Austrian leakage management.
A presentation ‘Learnings from implementing the IWA Methodology to National Water Loss Guidelines’ by Joerg Koelbl, to the IWA Water Ideas Conference 2014 (Bologna, Italy) is available at http://www.bluenetworks.at/BlueNetworks/Pub-WL_files/WL20_WaterIdeas2014_Koelbl_NationalGuidelines_20141023.pdf
Future Updates: Countries in Europe and elsewhere which already have sufficient ILI data to justify a separate Webpage within Global ILIs are invited to contact https://www.leakssuitelibrary.com/contact-us/