ILIs in Flanders 2014
All seven Flemish public water Utilities joined the AquaFlanders consultation group, formed in 2012, for the further development of modern water management practices and systems in northern Belgium. The latest IWA concepts for water loss and pressure management were introduced to the De Watergroep Utility in 2013. This was followed by a Workshop for all AquaFlanders Utilities in March 2014, after which each of the seven Utilities calculated their ILIs using a specially customised CheckCalcs Water Balance.
The AquaFlanders group recognised the ILI as being an improved approach for comparing technical leakage management performance between (and within) Utilities with widely varying consumption, connection density and operating pressure. The Utilities were then updated with the 2015 EU Reference Document ‘Good Practices on Leakage Management’ to which De Watergroep contributed a Case Study, and agreed to publication of their 2014 ILIs on the Global ILIs Section of the LEAKSSuite website (now LEAKSSuite Library).
Each individual water operator is required to report annually to the Flanders Environment VMM Water Regulator (established in 2010). Non Revenue Water was identified as one of the first processes to be benchmarked in 2015, and the IWA best practice KPIs were accepted for this purpose in close co-operation with AquaFlanders. Recently adopted legislation (June 2016) covering tariff regulation (June 10th, 2016) includes the ILI, CARL and UARL as indicators for ‘Quality of the network’ in the tariff plan template.
The Table below shows the range of infrastructure, pressure and leakage KPI characteristics of the seven AquaFlanders Utilities: AGSO, Knokke-Heist, De Watergroep, Farys, IWVA, Pidpa, Vivaqua and Water-link.
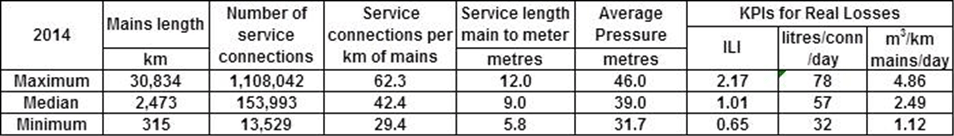
Classification of Utility infrastructure characteristics using Table 6 of the 2015 EU Reference Document Good Practices on Leakage Management are
Utility Size, based on number of service connections:
3 small, 1 medium, 3 large
Density of connections per km of mains:
1 small, 5 medium, 1 large
Average service length, main to meter:
3 small, 4 medium
In the Bar Chart below, the Leakage Performance categories next to the left side axis show that 6 of the 7 Utilities have ILIs in the ‘Very Low’ Category A1 (ILI < 1.5); the ILI of the 7th Utility is slightly above the Low/Moderate boundary for ILI. The Table at the end of the UARL & ILI Webpage provides further details on these Categories.
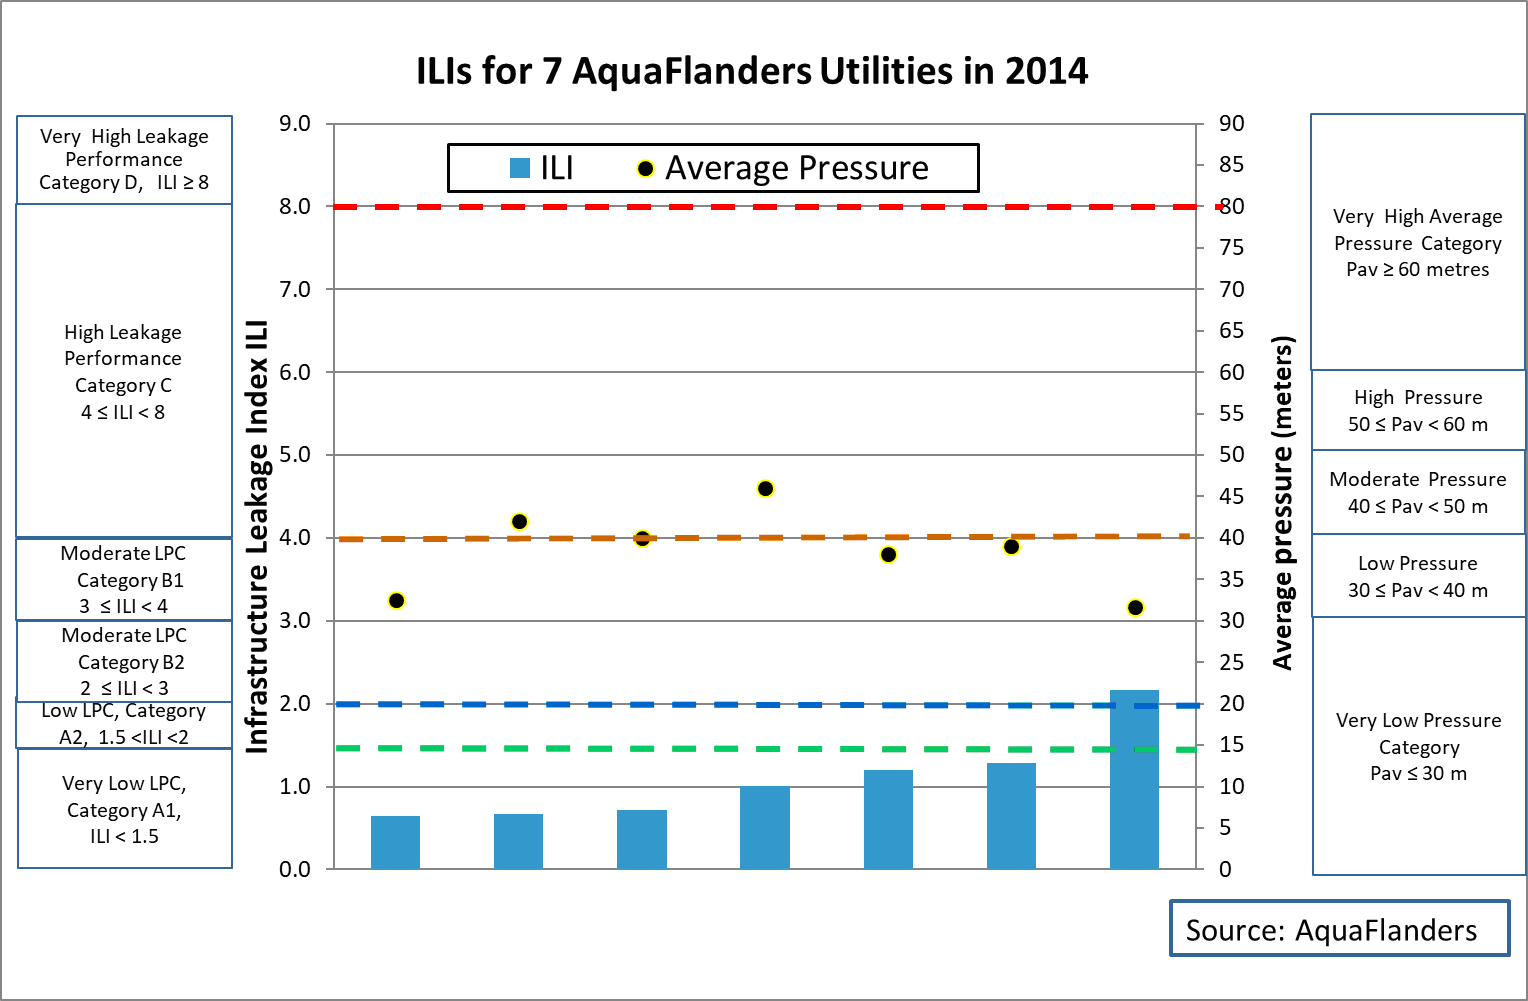
Reduction of excess pressures is the foundation for successful implementation of other complementary leakage control strategies. System Pressure categories next to the right side axis in the Bar Chart, are as recommended in the 2015 EU Good Practices Reference Document. They show that four AquaFlanders Utilities have average pressure in the Low (30 to < 40 metres) category, and 3 are in the Moderate (40 to < 50 metres) category.
District metered areas have also been actively promoted by AquaFlanders Utilities, and in larger Utilities the calculation of ILI within different regions of the Utility is helping to identify within-Utility differences in performance.
The comments on this ILI data by ILMSS Ltd do not purport to represent the opinions or policies of any individuals, Companies and Utilities which assisted in provision of the data.
Future Updates: Countries which already have sufficient good quality ILI data to justify a separate Webpage within Global ILIs are invited to Contact Us