ILIs in Europe – update 2014
Since 1999, ILIs have been calculated for many hundreds of systems in Europe. This 2014 update shows 71 ILIs from Utilities in 12 High Income European Countries, and 12 Utilities in 3 Low/Middle Income European Countries. It replaces a 2005 data set of 22 ILIs from 12 European countries, and the 20 European systems originally used to test the UARL equation and the ILI concept in 1995-99.
All of the calculated ILIs for High Income Countries in the graph below have come from sources and calculations considered to be reliable based on personal knowledge of IWA Water Loss Specialist Group members. However, it is recognised that greater consistency of all real losses calculations – particularly for low leakage systems – could be achieved by the introduction of Europe-wide guidelines relating to acceptable maximum default values for some assessed components of Water Balance calculations, with Utilities being required to justify higher values based on Utility-specific data

Sources: Austria, Belgium, Croatia, Cyprus, England/Wales, France, Germany, Italy, Malta, Portugal, Spain, Switzerland
Leakage Performance Categories A to D at the right hand side of the graph, introduced into World Bank Institute NRW Training Modules in 2005, can be briefly described as follows:
A: Further loss reduction may be uneconomic unless there are shortages
B: Possibilities for further improvement
C: Tolerable only if resources are plentiful and cheap
D: Inefficient use of resources, indicative of poor maintenance and system condition in general
Each Leakage Performance Category (LPC) is associated with a range of Infrastructure Leakage Index (ILI) figures and a set of recommendations for leakage management activities appropriate to that LPC. Many Utilities in Europe and internationally have now achieved ILIs close to 1.0, and in Australia in 2010 it was considered appropriate to split LPC A into A1 (ILI < 1.5) and A2 (1.5 < ILI < 2.0) to provide greater discrimination of technical performance at very low leakage levels.
Some quality control has been applied to the Water Balances and ILI calculations for 12 Utility systems in the 3 European Low and Middle Income Countries (LAMICs) shown below, but it is usually unrealistic to expect a high degree of reliability, without major investments in bulk and customer metering and billing systems. LAMICs, categorised as countries with average per capita income less than $12k per person per year, receive double the ILI range limits in the A/B/C/D Leakage Performance Categories. The splitting of LPCs into B1, B2, C1, C2, D1, D2 has also been found to be helpful in LAMIC countries, as it provides incentives to identify milestones along the journey in reduction of leakage.
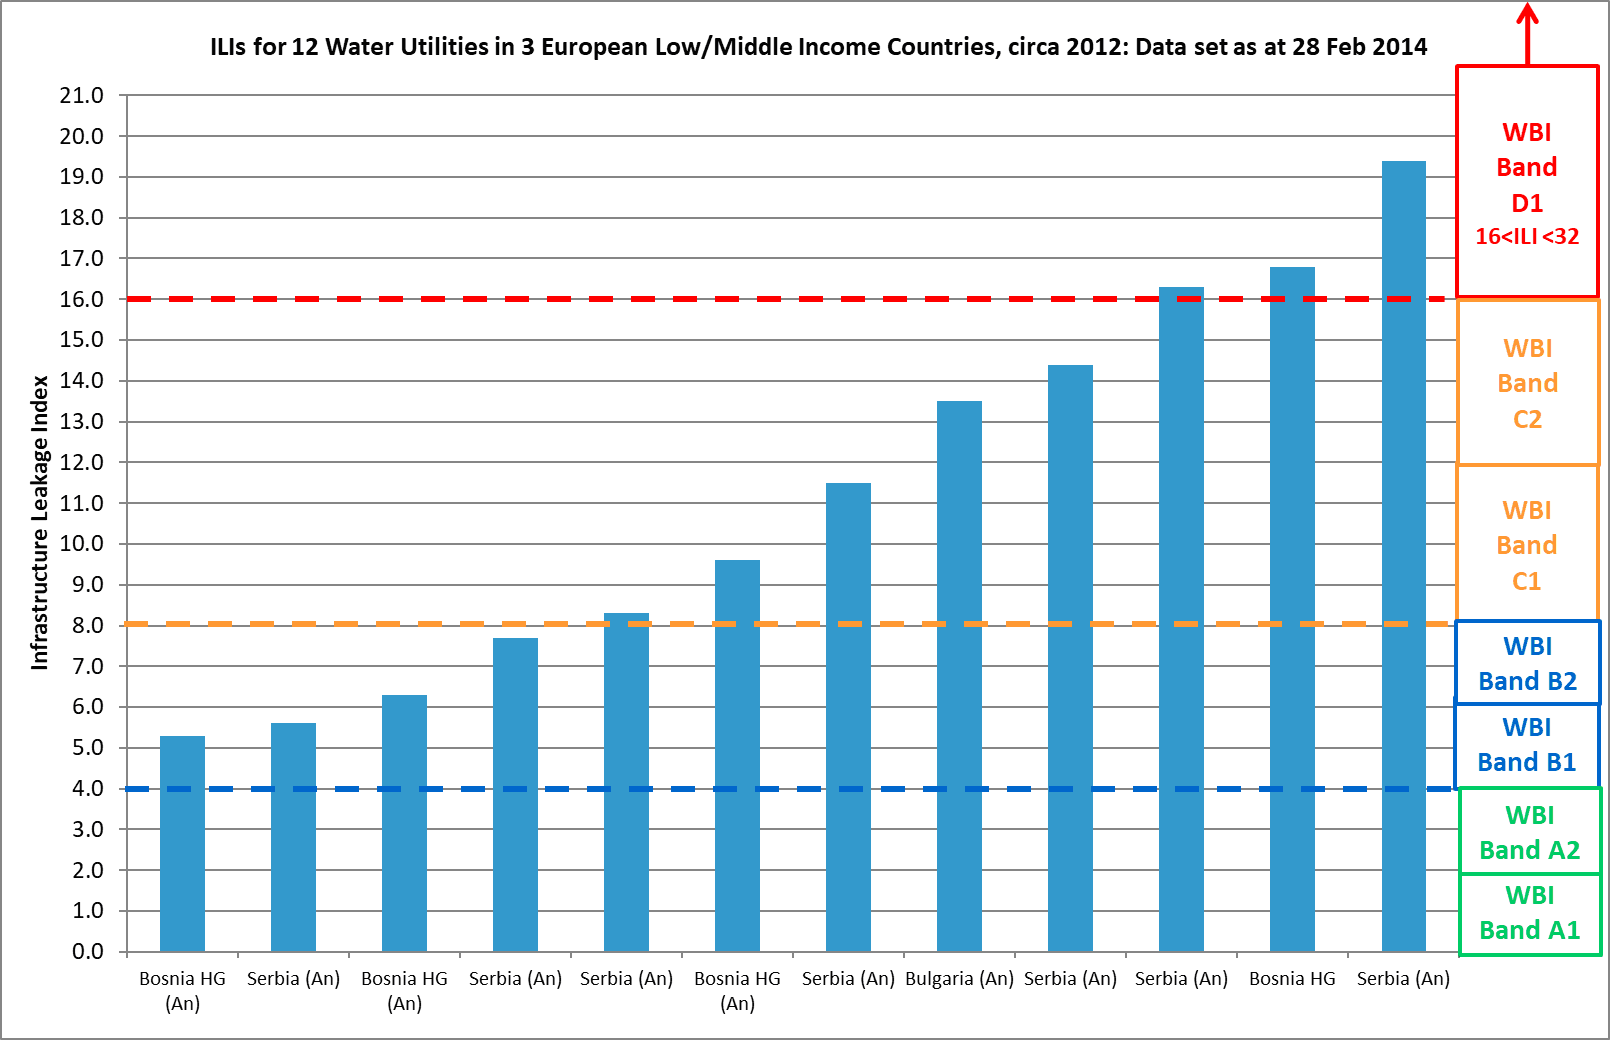
Sources: Bosnia–Herzgovina, Serbia, Bulgaria
Acknowledgements: thanks to all Utilities, Water Loss Specialist Group Members and others who have helped to formulate this latest European ILI data set.
Future Updates: European Utilities with reliable calculated ILI values wishing to be represented in future summaries of European ILIs on this website are invited to contact https://www.leakssuitelibrary.com/contact-us/. Countries in Europe and elsewhere which already have sufficient ILI data to justify a separate entry within Global ILIs are also invited to contact https://www.leakssuitelibrary.com/contact-us/