Professionals abandon %s of System Input Volume
Now 142 Supporters from 27 countries;
Register your support if you wish to join them
Einstein was quoted as saying that ‘everything should be as simple as possible, but no simpler.’ H.L Mencken’s aphorism stated that ’for every complex problem there is a solution that is simple, neat and wrong.’ Green considers that ‘Our world is complex, but we seek simple solutions that hide or ignore the complexity. The result is that our actions often have unintended side effects. These produce unwelcome trends, accidents and disaster’.
Over the past 25 years, an ever-increasing number of professional water conservationists have clearly recognized, from personal experience and analysis of managing diverse water supply systems, that expressing the volume of Non-Revenue Water and its components as a simple percentage of System Input Volume is usually fundamentally misleading, in terms of:
- Setting targets and tracking changes in management performance in individual Utilities
- Comparisons of technical efficiency of management between Utilities
- General conclusions regarding management of NRW and its components
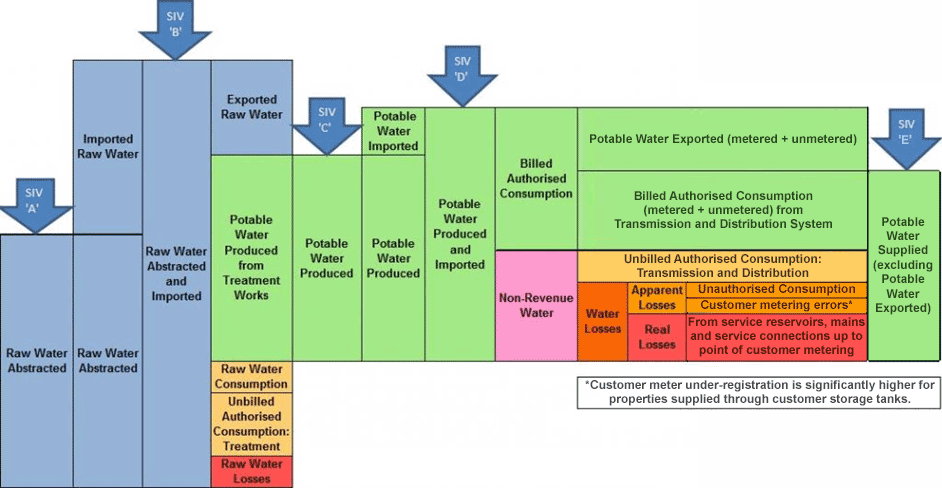
- Water balance with several SIV options showing Water Exported and Water Supplied (WS)
A reminder of some flaws in using % of System Input Volume, and % of Water Supplied
Countries and Utilities define SIV differently; which System Input Volume was used ?
If water is exported, NRW or Leakage volume as % of SIV will be smaller than NRW or Leakage volume as % of WS; how do you know which figure is being quoted?
As sum of all components of % SIV or % WS must equal 100%, this is a Zero-sum calculation; if both consumption volume and NRW volume are reduced, Consumption % and NRW% cannot both reduce in the same year, so true progress cannot be assessed.
Utilities with a high consumption base can more easily achieve a lower % of SIV or % of WS than Utilities with a low consumption base, for the same volume of leakage
Hourly and seasonal variations in consumption cause large hourly and seasonal variations in leakage as % of SIV or as a % of WS, even when daily leakage volume is constant
Alternative KPIs which do not suffer from the deficiencies of % of SIV and % of WS have increasingly become available since 2000 – for example, NRW as % of SIV by Value; Apparent Losses Index (ALI) and Infrastructure Leakage Index (ILI).
Accordingly, since 1995, an increasing number of national organisations and countries have abandoned or downgraded the use of % by volume of SIV or WS for these purposes, and began to use more appropriate and meaningful performance indicators, with more widespread beneficial results in sustainable water loss management. The world of water loss management is gradually changing for the better, but as always occurs with progress, some are leading from the front; others are lagging behind.
Even in countries where national organisations and Utilities have ceased to use percentages by volume for more than 10 years, it regularly occurs that some person or organization without the motivation, background or experience to understand the problem, or who considers they can ‘communicate’ better, or who simply wishes to generate headlines to emphasise perceived good or poor performance, will start quoting percentages and frequently draw misleading conclusions. In the internet age, this is then rapidly picked up, requoted by others and repeated. It is then necessary to spend time trying to inform the users of the unintended consequences and misunderstandings they have caused. Very few people welcome being advised after the event that they did not properly understand the issue they had commented on or the problems they had caused.
As a positive step to try to help people and organisations interested in NRW, who do not understand why percentages by volume can be so misleading, LEAKSSuite decided in December 2016;
a) to create this webpage ‘Professionals abandon Percentages of System Input Volume” (PaP)* in the KPIs Info-Hub to provide multiple readily accessible international references, papers, presentations and blogs (listed below) from around the world which confirm how misleading %s of System Input Volume can be, and
b) to encourage individuals, Companies and Organisations from many different countries to register your support of this initiative so that they can be included in a list of Water Professionals who have already abandoned the use of %s by System Input volume and % of Water Supplied as meaningful KPIs.
*The use of the acronym PaP is not accidental. The dictionary defines ‘pap’ as ‘material lacking real value or substance’.
In a hurry? Check a few International sources which quickly highlight the problems with %s
- Check out a few of the 6-slide summary case studies in PaPNotes
- OR take a quick look at KPIs Fit for Purpose
Many detailed international examples of why %s don’t work, and why Water Professionals don’t use them, appear in the Table below, which is in process of being extended to over 30 examples.
| COUNTRY | DATE | SOURCE | REFERENCE | WEBLINK |
|---|---|---|---|---|
| Europe | Sep 2019 | Water Loss Sep 2019, South East Regional Conference, Romania | Experiences in Real Loss Assessment 10-years after implementing the ILI as decisive Key-PI in Austria. Koelbl and Lambert | Presentation includes KPIs for European countries which stopped using %s |
| Canada, Province of Quebec | 22 March 2019 | Renewal of Québec Water Efficiency Strategy for 2019-2025 | Strategy drops use of %s and m3/km/day for water losses. Performance now benchmarked using ILI and average system pressure. Individual target ILIs allow for number of connections and water resources, operational and financial considerations. |
Québec Water Efficiency Strategy (French) AWWA Journal Article due mid-2020 |
| UK | Jan 2018 | Water Efficiency Network Website | OFWAT 2020 Price Review signals greater transparency : blog explaining ‘fit for purpose’ leakage performance indicators, showing why %s of SIV don’t work, and introducing the international UARL equation OFWAT’s 2020 Price Review will use to calculate ‘how low could you go’ | Leakage in the UK: Facts and Fallacies |
| USA | Dec 2017 | North American Water Loss 2017 Conference | Listening and Learning Session on the use of Percentage performance Indicators for Non-Revenue Water, with presentation by Kunkel, Merks and Jernigan. A clear majority of the attendees at the Listening and Learning session supported discontinuing the use of volumetric percentage performance indicators. | NAWL2017 Listen and Learn % Module |
| International | Nov 2017 | Article in Water & Wastewater International | Water Losses: It’s time to ditch the percentages. A WWi article by Allan Lambert highlights significant flaws in using a traditional KPI, NRW as a % of System Input Volume, and endorses the Professionals abandon %s initiative. | Water and Wastewater International Article |
| International | Aug 2017 | Blog for IWA Website | Reliable operational Performance Indicators are critical to address water losses |
Reliable Operational PIs for Real Losses (Link to Original Article) |
| International | July 2017 | Presentation | NRW as a % of System Input Volume just doesn’t work! Merks, Shepherd, Fantozzi, Lambert at IWA Water Efficient 2017 Conference, Bath, UK. 18-20 July 2017. | Presentation 2017N |
| International | May 2017 | Presentation | NRW as a % of System Input Volume just doesn’t work! PI 2017 Conference of the IWA-benchmarking and performance assessment group in Vienna, Austria, May 15-17 2017 | Presentation 2017C |
| Europe and International | Oct 2016 | Presentation at Water Ideas 2016, Bologna |
Regulation in water loss management and benchmarking to achieve efficiency: an International perspective. | Presentation 2016Q |
| United Kingdom | May 2016 | Blog | England & Wales Water Company Leakage Rises – or Falls? Consumer Council for Water Report confuses interpretation of leakage statistics | Interpreting Leakage in England & Wales |
| International | Feb 2016 | Presentation at IWA Water Loss Bangalore | Leakage Performance Indicators ‘Fit for Purpose’: updates from Austria, Bulgaria, Croatia, Germany, South Africa (KwaZulu-Natal), Canada (Quebec), Romania | Presentation 2016D |
| U.S.A. | Feb 2016 |
AWWA Manual of Water Supply Practices
M36. Water Audits and Loss Control Programs 4th Ed. |
Table 1.1: Non-preferred term: % of System Input Volume to measure Water Loss Performance. Preferred term: Suite of Key Indicators for Water Losses as outlined in AWWA Audit method in Chapter 3. Reason: A %-based expression obscures the underlying components of water loss and impedes realistic solutions based on system specifics. |
ISBN-13 978-1-62576-100-2 eISBN13 978-1-61300-339-8 |