Unavoidable Annual Real Losses & Infrastructure Leakage Index
How Low Could You Go?
The first IWA Water Loss Task Force developed a system-specific equation for the lowest technically achievable Annual Real Losses, for well managed infrastructure in good condition. The UARL concept is similar to the calculation of ‘par’ score for a golf course, based on the length of fairways (around 1 shot per 180 metres) and the number of greens (2 shots per green).
Substituting appropriate parameter values in a simplified Component Analysis of annual Real Losses, for well managed infrastructure in good condition, an equation to calculate Unavoidable Annual Real Losses (UARL) was derived ( Lambert et al, AQUA, 1999):
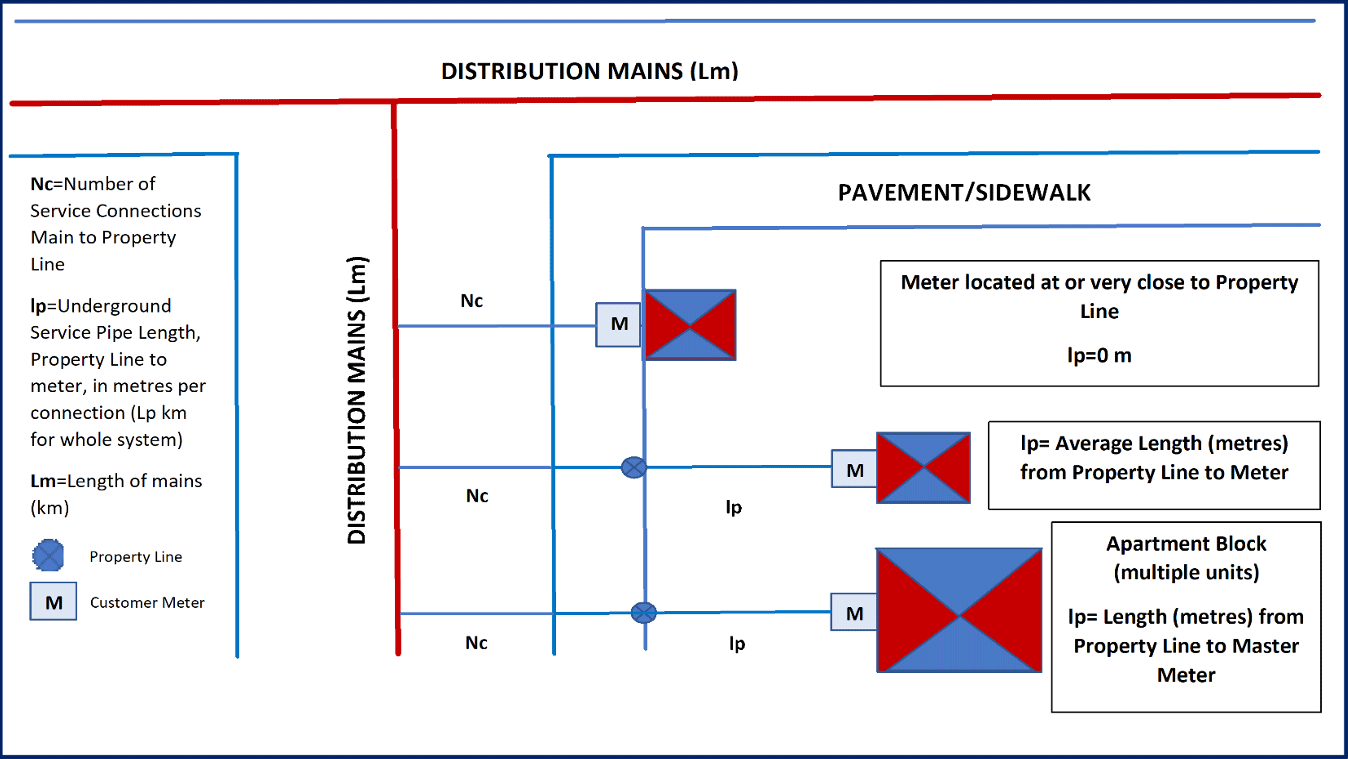
UARL (litres/day) = (18 x Lm + 0.8 x Nc + 25 x Lp) x P
Or UARL (m3/year) = (6.57 x Lm + 0.292 x Nc + 9.132 x Lp) x P
Lm = mains length (km),
Nc = number of service connections (main to property line)
Lp = total length of underground pipes, property line to meter = Nc x lp/1000 (km),
P = average pressure (metres)
UARL equations can be shown in a variety of units and formats. In Europe, many Utilities know the length of their service connections (main to first meter) and calculate their annual real losses as a volume per year, so the equation for UARL used is :
UARL (m3/year) = (6.57 x Lm + 0.256 x Nc + 9.13 x Lt) x P
where Lt = total length (km) of underground service connections (main to meter).
The UARL equations can be used to predict, with reasonable reliability, the lowest technically achievable annual real losses for any combination of mains length, number of connections, customer meter location and average operating pressure – assuming the distribution system infrastructure is in good condition with high standards for management of Real Losses.
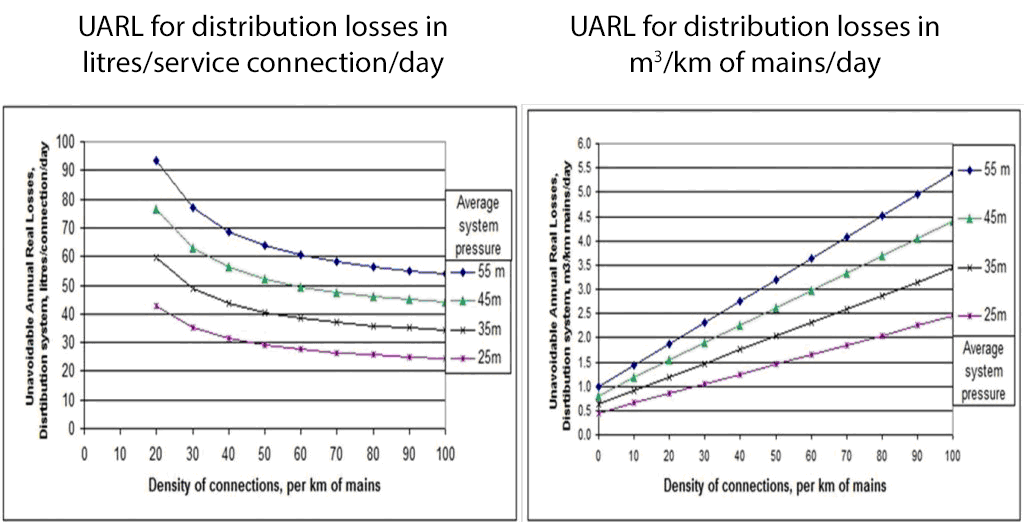
The graphs below show UARL in litres/service connection/day, and m3/km mains/day, for systems with customer meters located at the property line, for a typical range of connection densities and average system pressure. Similar graphs can be created for systems where customer meters are located at a specified distance after the property line.
Since 1999, UARL has been calculated for thousands of international Utilities; some have been able to achieve it, but only some with small systems, and/or low pressures or fewer unreported leaks than assumed in the UARL equation, can consistently beat it.
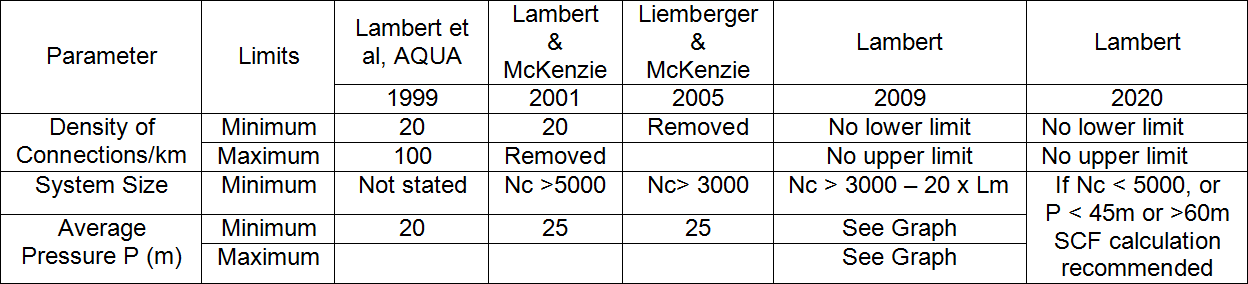
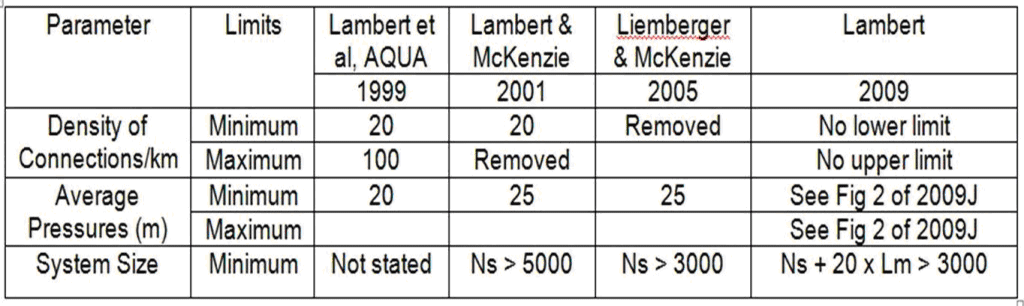
Lower and upper limits on system size and average pressure for use of the UARL equation have been cautiously changed since 1999, as shown in Table 1 below. By 2014, research into good quality data from small systems in Austria and Denmark had shown that small stand-alone systems with fewer than 3000 service connections could achieve leakage less than that calculated by the UARL equation, particularly at pressures below 40 metres with flexible pipes having high FAVAD N1 values.
Table 1: Changes in UARL Equation Upper and Lower Limits 1999- 2020
Source: Lambert (2020)
The System Correction Factor (SCF) concept calculates interactions between system size, median burst frequencies, pressure and %s of rigid and flexible pipe materials. SCF is a non-dimensional multiplier which can be applied to the UARL equation to customise UARL volume for smaller systems and DMAs, or for average pressures outside the 45 to 60 metres range, when the UARL equation may under-predict or over-predict by more than around 10% for some combinations of size, infrastructure, pipe materials and pressure.
Low-ilis-and-small-systems explains how the UARL with SCF concept allows for interaction between system size, burst frequency, pressure and %s of rigid and flexible pipe materials.
UARL is also used in the calculation of the Infrastructure Leakage Index (ILI):
ILI = Current Annual Real Losses (CARL)/UARL
In the ASEAN Region, the CARL is also known as the CAPL (Current Annual Physical Losses) and UARL is also known as the MAAPL (Minimum Achievable Annual Physical Losses); so ILI = Current Annual Physical Losses (CAPL)/MAAPL
The Global ILIs webpages show ILIs from an ever-increasing number of countries.
The ILI is used in an International Leakage Performance Classification system for Real Losses management performance, and identifying recommended strategies for improvement, as shown in the following Tables.
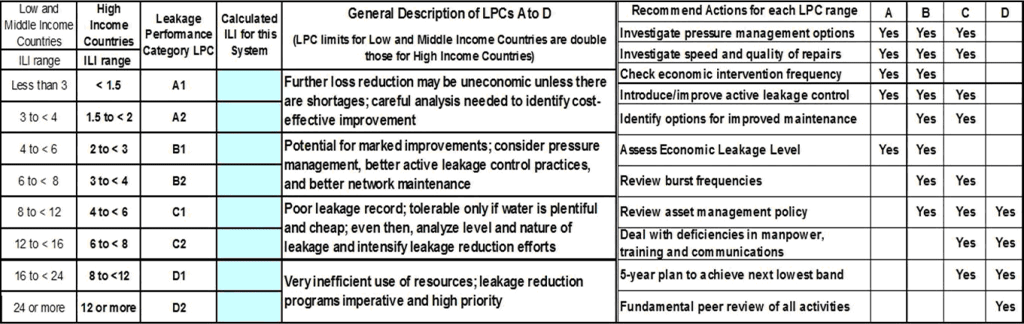
The International Leakage Performance Category (LPC) classification system is used to identify general recommended strategies for improvement. The LPC classification has 8 categories (A1 to D2); LPC boundary values of ILI for Low and Middle Income Countries (LAMICS) are twice as large as boundary values for High Income Countries (HICs) , so it is necessary to identify if a particular country is an HIC or a LAMIC.A list of High, and Low/Middle income countries (with High/Middle break point around $US 12 to $US13k median per capita income) can be found at http://chartsbin.com/view/2438